



For molecular modelers, accurately assessing the shape changes of molecular groups over a path or trajectory is a crucial task. One common challenge is evaluating how much a selected group of atoms deviates from a perfect spherical shape, especially when more nuanced descriptors are required than basic ones like distance or radius. This is where the concept of Asphericity comes into play.
Asphericity is a powerful shape descriptor that gives insight into how a selected group deviates from a spherical geometry along a path or trajectory. It is particularly useful for monitoring anisotropy and avoids oversimplification by presenting more detail than single distance metrics. Here, we’ll walk through how you can utilize the Asphericity analysis tool in SAMSON’s Path Analyzer to streamline this process and gain valuable insights into your molecular system.
Why Use Asphericity?
Asphericity becomes indispensable in cases where the basic radius of gyration provides too coarse a representation of the molecular behavior. It captures the additional details of shape anisotropy, which can be significant—for example, when tracking global shape changes during conformational transitions or chemical processes. Pairing asphericity with complementary descriptors like the radius of gyration and shape parameter enables modelers to construct a more comprehensive picture of their systems.
Getting Started
To begin using the Asphericity analysis in SAMSON, follow these steps:
- Open the Path Analyzer in SAMSON.
- Set Asphericity as the observable parameter.
- Select your path or trajectory for analysis.
- Define the group of atoms for which you wish to evaluate asphericity.
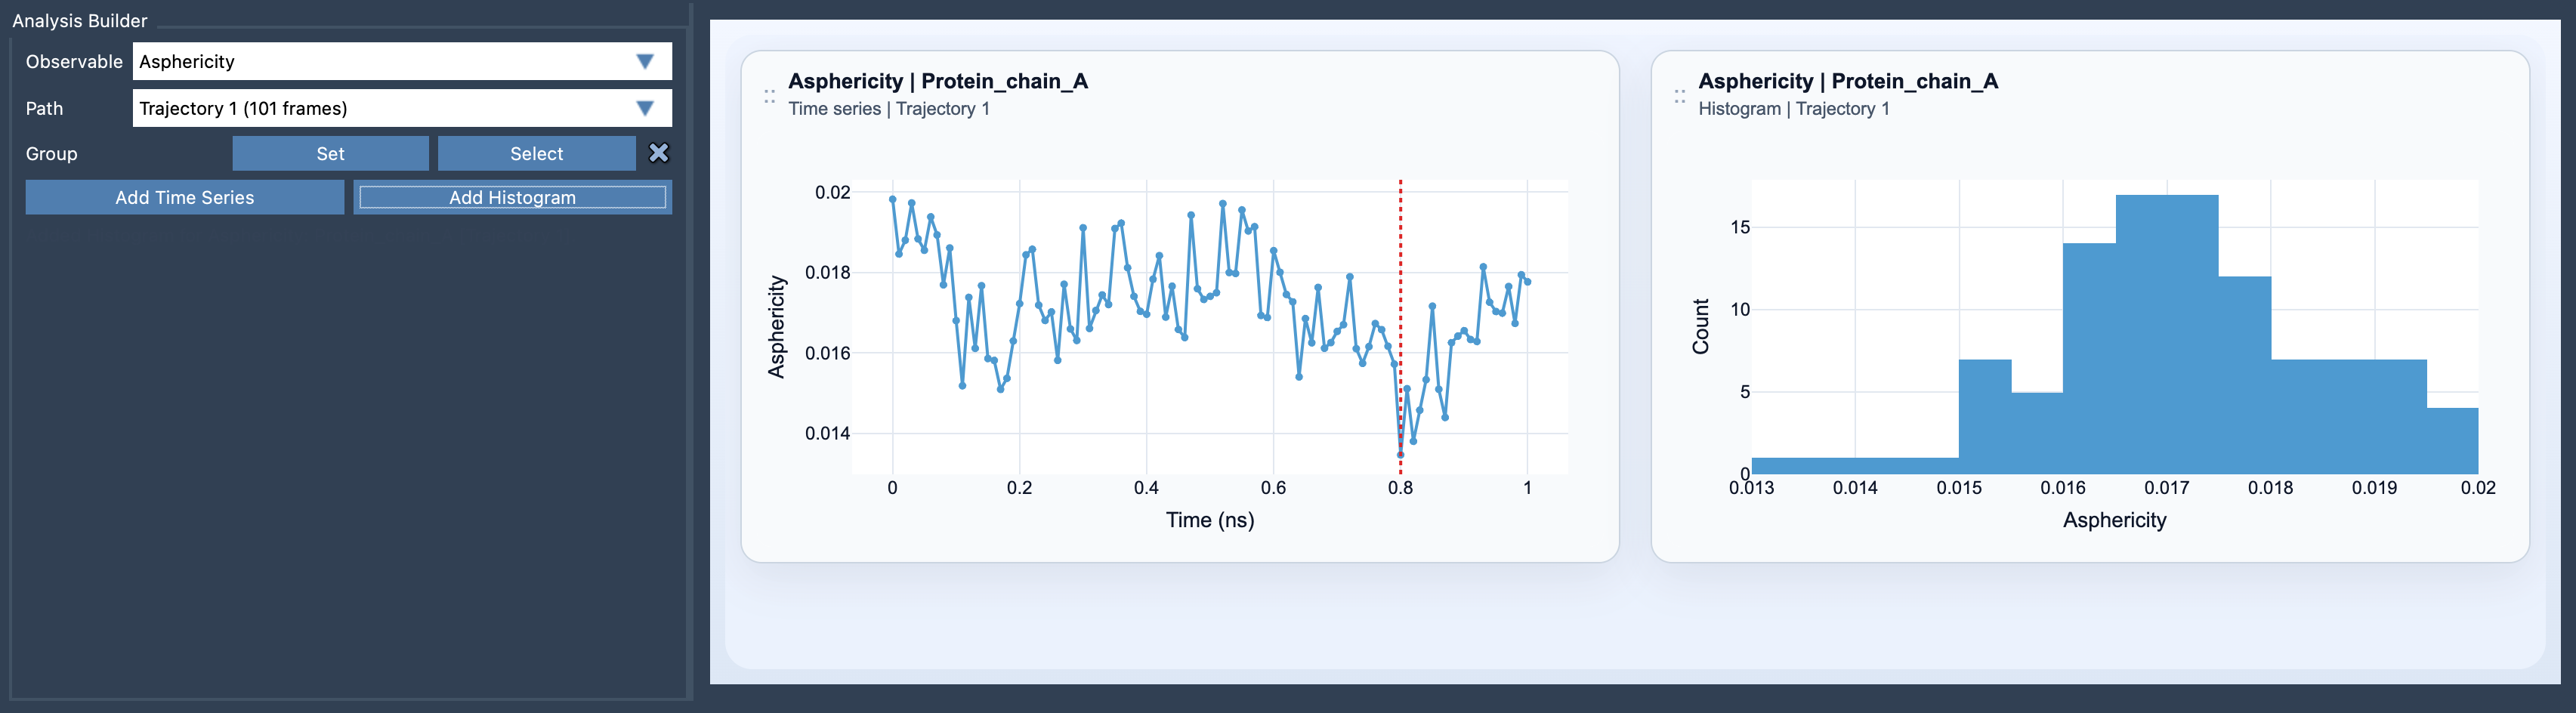
- Choose the type of analysis output: Add Time Series (to track changes over time) or Add Histogram (to examine the distribution of sampled values).
SAMSON makes the entire workflow intuitive, allowing you to tailor the analysis to your specific goals. For example, the time series view is excellent for dynamic monitoring of shape changes, while the histogram showcases the statistical distribution, helping identify predominant conformational states.
Practical Tip
Pro Tip:
- Pair Asphericity with complementary metrics like the Radius of Gyration and Shape Parameter. This combination provides a multi-faceted insight into the molecular shape evolution.
Visualize Your Results
After running the analysis, SAMSON allows you to generate visual outputs such as graphical time series and histograms. These can be invaluable for interpreting the data, presenting detailed insights, and even integrating into presentations or publications. For example, below is a sample of the Asphericity graph:
Conclusion
Asphericity is a precise and effective way to understand how molecular shapes evolve along a path or trajectory. By combining it with SAMSON’s intuitive Path Analyzer, molecular modelers can efficiently track shape anisotropy and refine their understanding of molecular behavior.
For more details and a complete guide, explore the original documentation here: https://documentation.samson-connect.net/users/latest/references/path-analyzer/asphericity/.
Note: SAMSON and all SAMSON Extensions are free for non-commercial use. You can download SAMSON at https://www.samson-connect.net.