



For molecular modelers, the ability to measure and analyze distances between selected groups in a molecular system is invaluable. Whether you’re investigating domain motions, tracking binding site transitions, or monitoring specific contacts during a molecular trajectory, understanding these distance-based dynamics can provide critical insights into your system. SAMSON’s Distance analysis, available within the Path Analyzer module, offers an intuitive yet powerful way to achieve just that.
The Value of Distance in Molecular Modeling
Consider a scenario where you’re analyzing how a drug molecule interacts with a binding site. How do you quantitatively track whether the drug remains in contact, the binding site opens or closes, or if conformational changes occur in the protein? SAMSON’s Distance analysis can simplify this by measuring the separation between two groups of atoms along a trajectory, helping you address these questions with clarity.
You can define these groups (referred to as Group A and Group B in SAMSON) based on your study’s focus, such as specific residues, chains, or domains. Once selected, various distance types can be calculated, such as:
Centroids: The average positions of atoms in each group are compared, generating a smooth, high-level descriptor of the motion.Minimum: The closest contact between any two atoms of the selected groups is tracked, ideal for monitoring critical interactions.- Axis-specific minima (e.g., Minimum along X): These allow you to focus on motion along a particular axis.
How to Add a Distance Plot
Setting up a Distance analysis plot is straightforward in SAMSON:
- Open the Path Analyzer.
- Select Distance in the Observable options.
- Define Group A and Group B by selecting the atoms you’re interested in.
- Choose a distance type based on your analysis needs.
- Click the Add Time Series or Add Histogram button to create your desired view.
For example, the time series view allows you to track how the distance evolves over time or along the trajectory, while the histogram view provides a distribution of sampled distances, helping you identify specific trends or behaviors.
Practical Applications and Tips
When working with Distance analysis, here are some important considerations:
Centroidsmode is fantastic for examining broader motion trends, like overall separations between domains or large molecules.- If you’re more interested in the closest contact events (e.g., pin-pointing when two molecules touch), use the
Minimummode. - To simplify or tailor your analysis, start with small atom selections for chemically specific interactions, and use larger groups like residues or chains for a coarse-grained overview.
- Remember that the centroid calculation relies on the geometric average of atom positions, offering a different perspective compared to center-of-mass-based calculations.
Saved distance analyses can also be integrated into downstream visualizations, such as Custom scatter, 2D density maps, or Energy landscapes. These advanced analyses help you further interpret and communicate your molecular modeling results effectively.
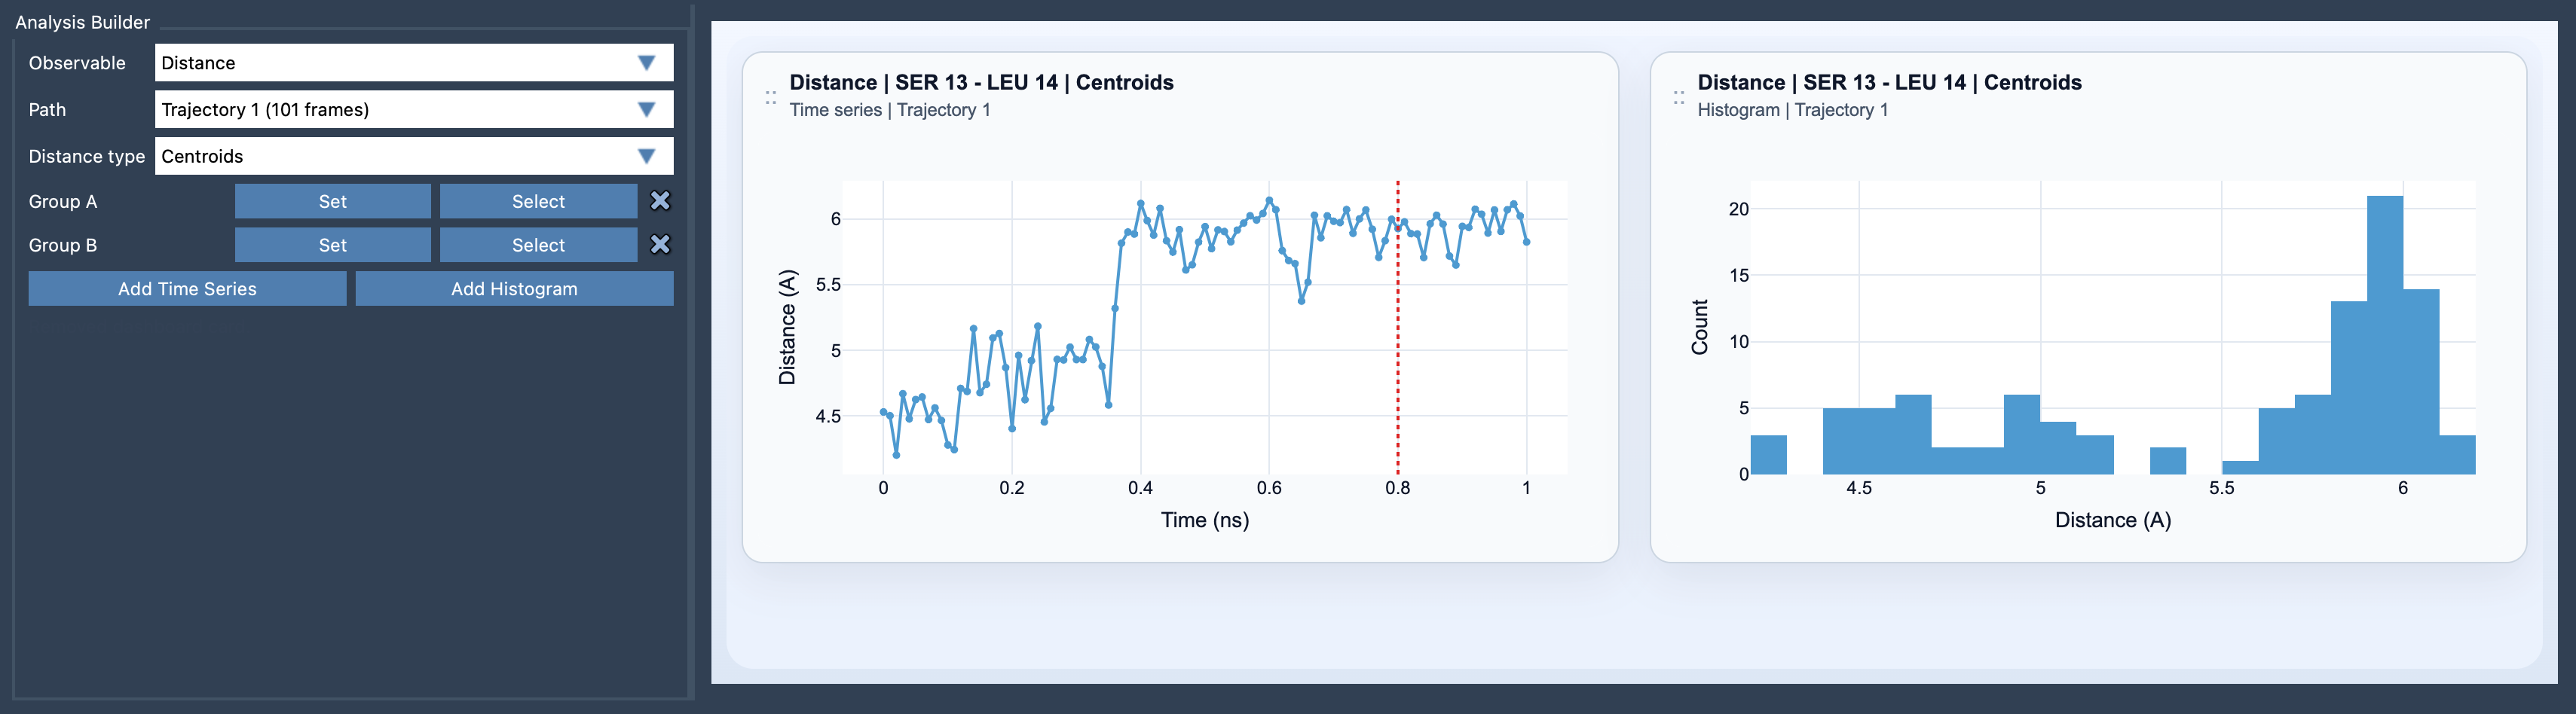
By using SAMSON’s Distance analysis, you can effortlessly track and visualize intricate molecular dynamics, empowering you to uncover meaningful trends in your simulations.
To dive deeper into Distance analysis in SAMSON, check out the official documentation at SAMSON Distance Analysis Documentation.
Note: SAMSON and all SAMSON Extensions are free for non-commercial use. You can download SAMSON at www.samson-connect.net.