



A molecular structure can look almost unchanged while a side chain rotates, a backbone torsion shifts, or two parts of a molecule twist relative to one another. Those movements can matter when you are comparing conformations along a path or trajectory—but they are easy to miss if you only inspect structures one at a time.
A dihedral angle turns that kind of rotation into a measurable quantity. In SAMSON’s Path Analyzer, it is defined using four groups arranged in order: A, B, C, and D. The angle describes the relative orientation of the two planes formed by the first three and last three representative positions. Groups B and C define the central bond or geometric axis around which the torsion is measured.
Why four groups matter
Choosing the groups is not just a matter of selecting four convenient pieces of the structure. Their order determines which torsion you are measuring. A useful way to plan is to identify the motion you want to track, then select groups that represent the two sides of the rotation and the central axis between them. For a backbone torsion or a rotamer, this helps you focus on the specific twist of interest rather than a general change in the molecule’s shape.
Each selection must contain atoms. If a group contains one atom, Path Analyzer uses that atom’s position. If it contains multiple atoms, the group is represented by its center of mass. This distinction is important: a multi-atom selection does not contribute each atom as a separate point in the torsion calculation. Instead, the selection is summarized by one position. Keep that in mind when defining groups, especially if a broad selection could shift its center of mass in ways that obscure the local rotation you intended to follow.
From a structural motion to a plot
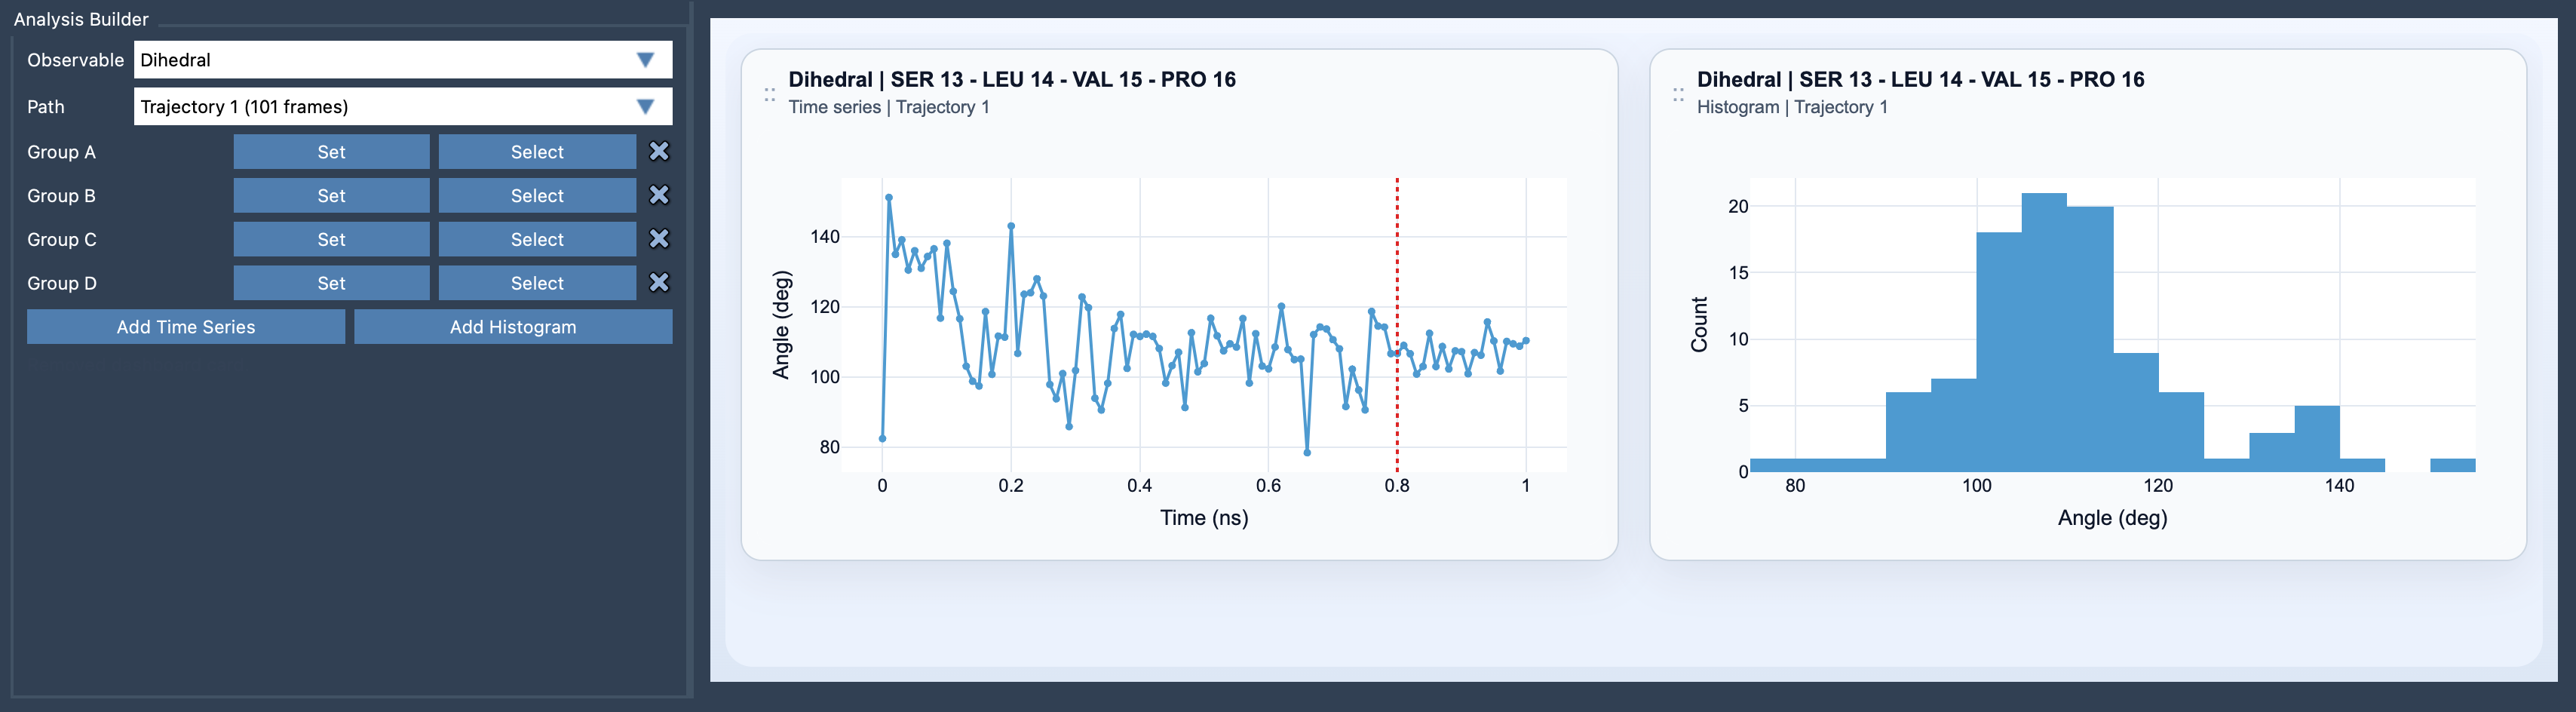
To create the analysis, open Path Analyzer, choose Dihedral as the observable, select a path, and define Groups A through D. Then choose Add Time Series or Add Histogram. The angle is reported in degrees.
The time series is the better view when the timing or location of a transition matters. It lets you follow the torsion across time or across the images of a path, so you can see where the angle changes. The histogram answers a different question: which torsional states occur most often along the sampled data? It can help you spot preferred or metastable conformations, but it does not show when a transition happened.
A practical way to investigate a twist
Start with a question that the angle can answer: does this torsion change along the path, and are there distinct states? Define the four groups to match that question, then inspect the time series for changes and the histogram for the distribution of angles. If the plot looks unexpected, check the group order and selection size first. Since multi-atom groups are represented by their centers of mass, changing the selected atoms can change the measured positions—and therefore the angle.
A dihedral is most useful when interpreted alongside other evidence. For example, pairing it with RMSD can help you compare a local torsional change with broader structural differences; pairing it with Energy can help you examine whether conformational changes coincide with energetic changes. These measurements provide complementary views rather than replacing careful inspection of the structures.
For the setup details and the mathematical definition, see the Dihedral analysis documentation.
Note: SAMSON and all SAMSON Extensions are free for non-commercial use. Get SAMSON.