



A molecular structure can change its overall shape even when a familiar size measure appears almost unchanged. For example, a group of atoms may become more elongated or less spherical without a dramatic change in its overall spread. If you are comparing structures along a path or trajectory, that can make it difficult to tell whether the group is simply changing size or changing shape.
Asphericity helps address this blind spot. In SAMSON’s Path Analyzer, it reports how far a selected group deviates from a spherical shape. Rather than reducing the shape description to a single distance, it gives you a way to follow shape anisotropy along a path.
Ask a more useful shape question
Radius of gyration is useful for tracking how widely a group of atoms is distributed. But it is not a complete description of shape: two structures can have similar overall size while differing in how their atoms are arranged. Asphericity offers a complementary perspective by focusing on deviation from a spherical shape.
This distinction is useful when you want to ask questions such as: Does the selected group become more elongated at some point along the path? Does its shape vary across the sampled structures? Does a change in overall spread coincide with a change in shape? Asphericity can help you investigate these questions, but it should not be treated as a complete explanation of the molecular change. It describes one aspect of the selected group’s shape.
Set up an asphericity analysis
- Open Path Analyzer.
- Choose Asphericity as the observable.
- Select the Path you want to analyze.
- Define the atom-containing Group whose shape you want to follow.
- Choose Add Time Series or Add Histogram.
The group selection matters: the result describes the group you chose, not automatically the whole molecule or another region. If you are comparing analyses, keep the group definition consistent so that differences in the result are not simply caused by changing which atoms are included.
Choose the view that matches your question
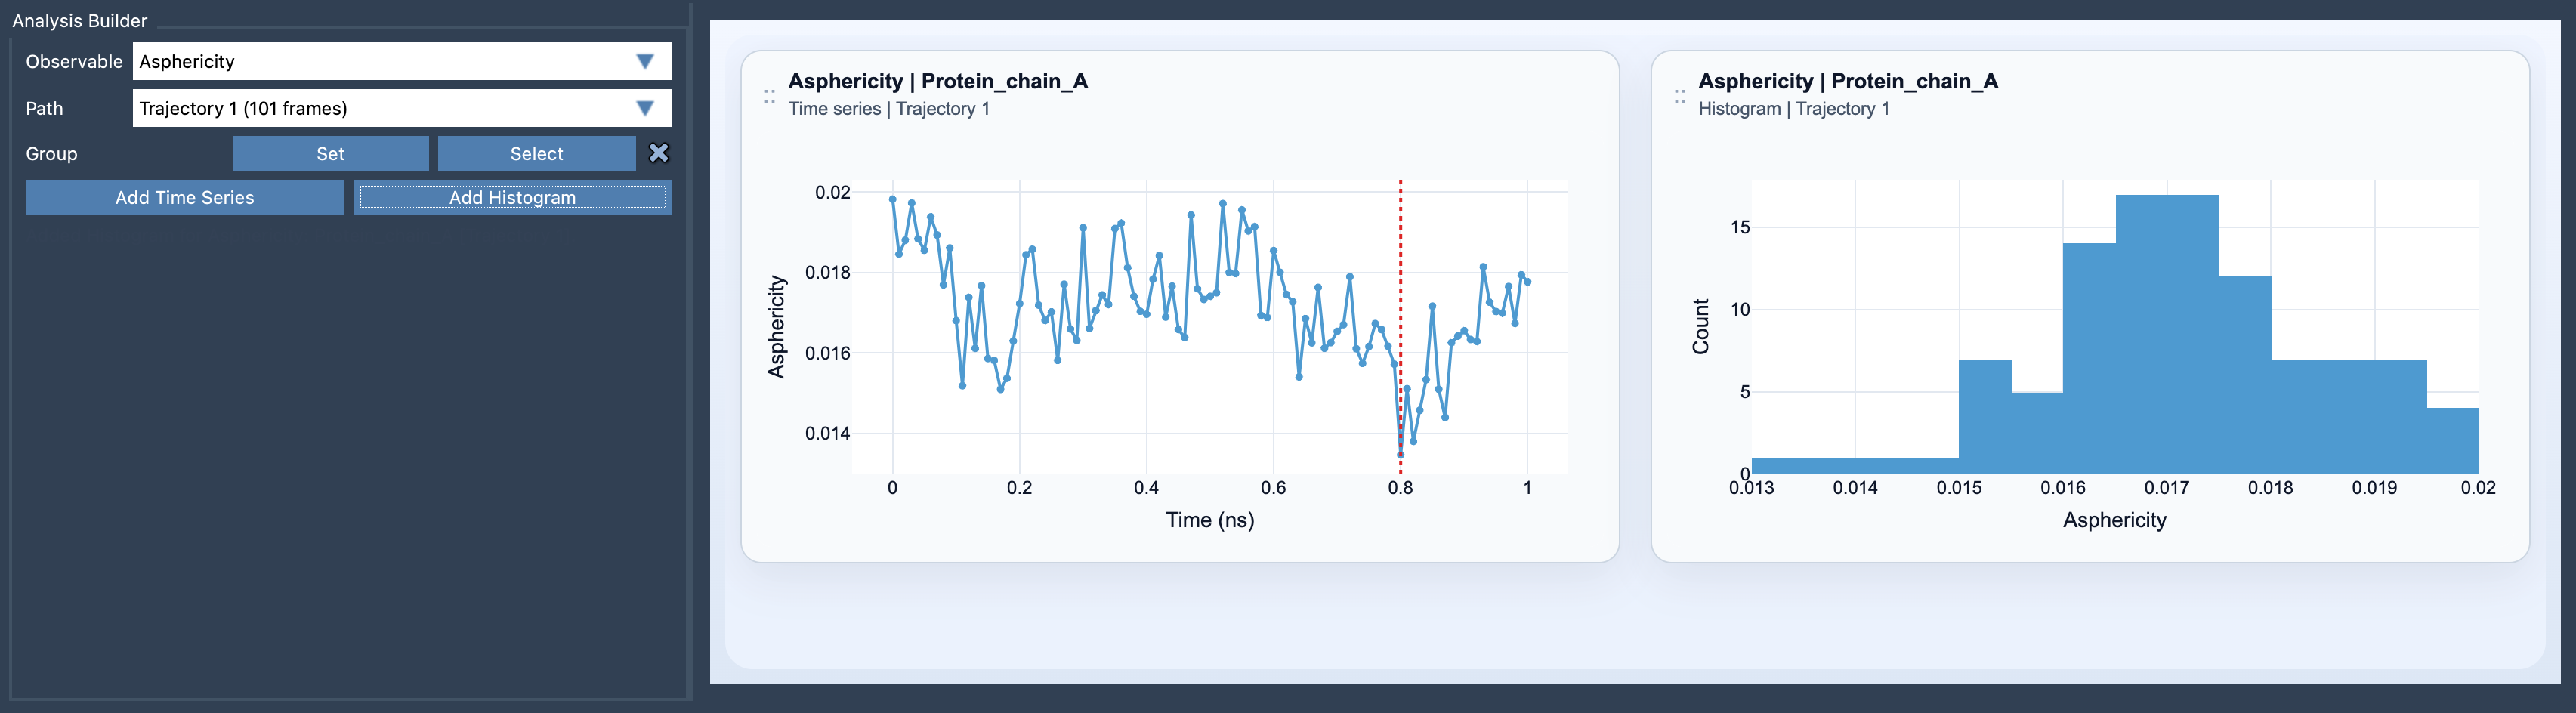
A time series shows how the shape descriptor changes along the path. Use it when you want to see where shape changes occur and whether they appear gradual or concentrated in a particular part of the path. The plot is a guide to where to look more closely; it does not, on its own, explain the molecular cause of a change.
A histogram helps you inspect the range of sampled asphericity values. It can provide a compact view of how values are distributed across the path, but it does not preserve the order in which those values occurred. If sequence matters to your question, inspect the time series as well.
Build a fuller picture
For a more rounded view of global shape changes, compare asphericity with radius of gyration and shape parameter. These observables provide complementary descriptions, so looking at them together can help distinguish a change in overall spread from a change in shape. Interpret the plots in the context of the structures and the group being analyzed, rather than relying on any single descriptor.
When a size measure seems too coarse to answer your question, asphericity is a practical next view: it lets you track how spherical—or non-spherical—the selected group is along a path. Learn more in the Asphericity documentation.
Note: SAMSON and all SAMSON Extensions are free for non-commercial use. Get SAMSON.