



Umbrella sampling turns a difficult molecular process into a set of simulations centered on different parts of a reaction coordinate. But after those simulations finish, an important question remains: how do you combine the windowed data into one profile—and how can you tell whether the coordinate was sampled well enough?
In GROMACS Wizard, the WHAM Analysis tab uses the Weighted Histogram Analysis Method (WHAM) to compute a Potential of Mean Force (PMF) from umbrella-sampling data. The PMF gives you a profile along the selected reaction coordinate, while a companion histogram helps you inspect how well the coordinate space is covered.
Start with a consistent set of windows
Before opening the analysis, finish the umbrella-sampling workflow. The input folder should contain numbered subfolders that belong to the same system and use the same reaction-coordinate definition. This consistency matters: the analysis combines data across windows, so mixing projects with different systems or coordinate setups can make the result difficult to interpret.
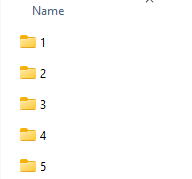
In the GROMACS Wizard, switch to WHAM Analysis and choose the project path. If the previous project you ran was the umbrella-sampling simulation, you can use auto-fill to populate the path. Otherwise, select the appropriate project yourself and verify the folder contents.
Run the analysis without losing track of your choices
The wizard loads reaction-coordinate information, the time range, and temperature from the project automatically. Then:
- Select the reaction coordinate you want to analyze.
- Review optional settings. You can adjust custom bounds, the time range, or energy units when needed.
- Click Compute.
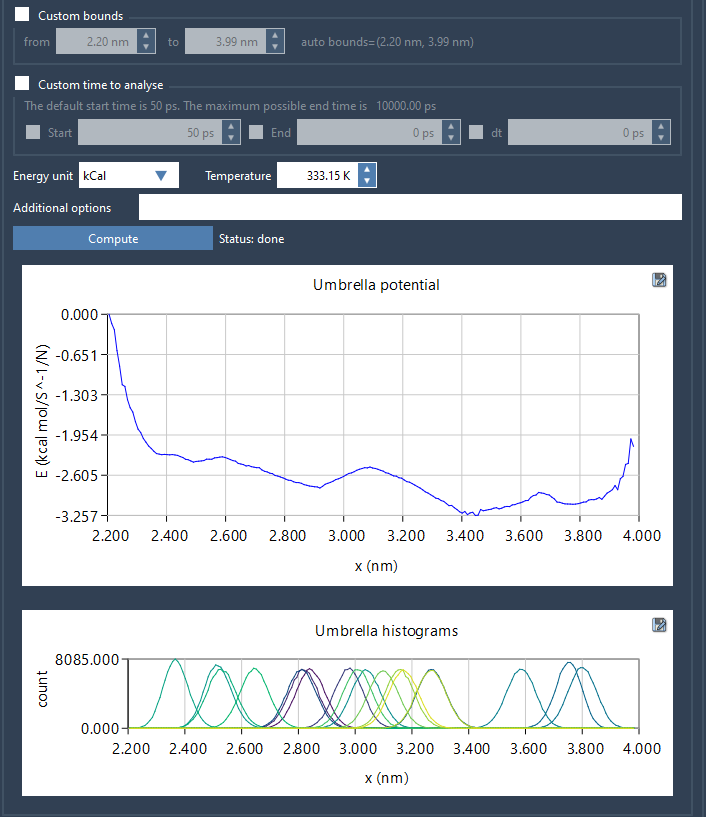
For large trajectories, the calculation may take several seconds or minutes. Once it finishes, the wizard produces two plots: the PMF profile and a histogram of coordinate coverage.
Read the histogram as a sampling check
The histogram is useful because a PMF profile on its own does not show you how the underlying coordinate space was covered. Inspect the histogram for regions where coverage appears limited. Those regions are a prompt to review whether more sampling may be needed—not a guarantee that the sampling is sufficient everywhere.
If coverage suggests a gap, return to the umbrella-sampling workflow and consider adding or extending simulations for the relevant windows. Then run the analysis again. This makes the workflow an iterative one: compute the profile, inspect coverage, and use that inspection to guide where additional sampling may help.
Keep results organized
GROMACS Wizard saves profiles, histograms, and plots in the project’s wham_results subfolder. If you later switch reaction coordinates, the tool reuses data already computed for the same parameters. Keeping the project and its settings together makes it easier to revisit the analysis and understand which outputs belong to which run.
Quick pre-compute check: confirm that the windows belong to one system, share the same reaction-coordinate definition, and are in the intended project folder. After computation, look at both outputs: use the PMF to inspect the profile and the histogram to identify regions where additional sampling may be worth considering.
For the complete walkthrough, visit the GROMACS Wizard PMF Analysis tutorial.
Note: SAMSON and all SAMSON Extensions are free for non-commercial use. Get SAMSON.