



A molecule can change shape without making its overall size look very different. That is a frustrating blind spot when you are reviewing a conformational path: a single size measure may not tell you whether the selected atoms remain roughly spherical or become more elongated or otherwise anisotropic.
Asphericity helps address this particular question. In SAMSON’s Path Analyzer, it reports how far a selected atom-containing group deviates from a spherical shape along a path or trajectory. It is a shape descriptor, not a replacement for every other structural measurement. Used alongside size and other shape measures, it can help you tell a more complete story about what changes over the path.
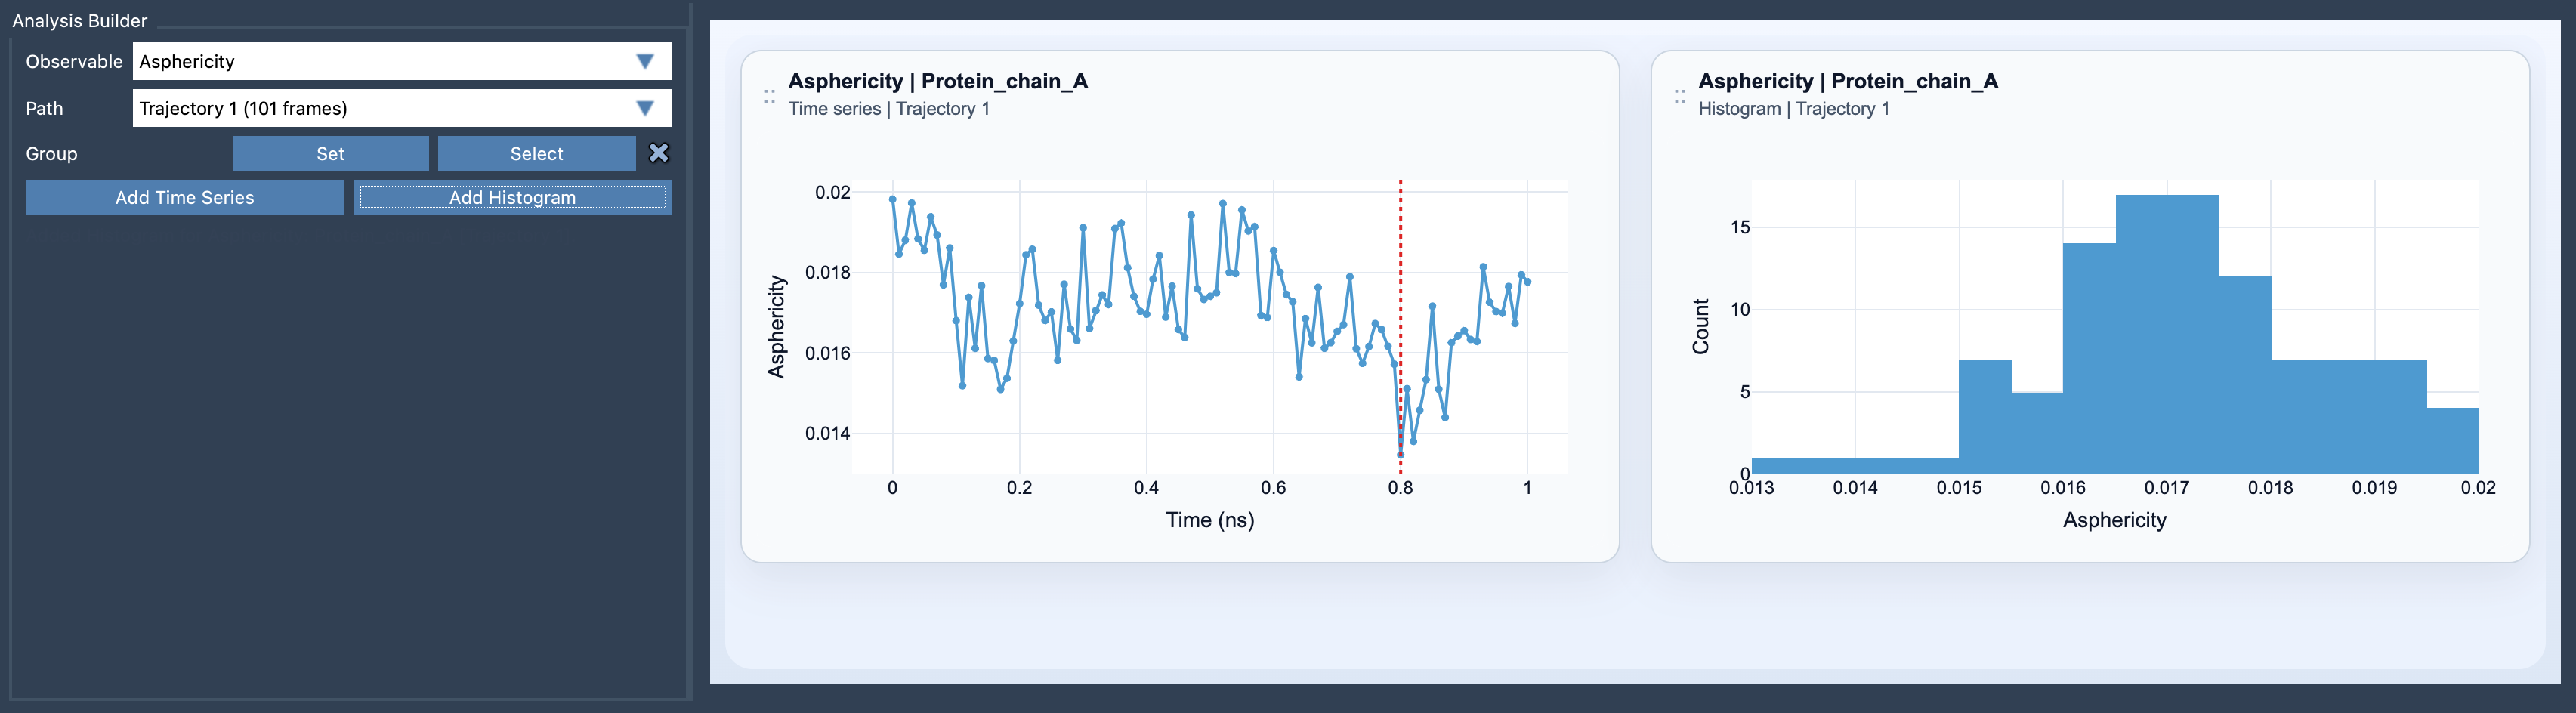
Ask a shape question, not just a size question
Radius of gyration is useful for following the overall spread of a group of atoms. But if your question is specifically about whether that group departs from a spherical shape, radius of gyration alone can be too coarse. Asphericity gives you a separate descriptor to inspect for that purpose.
This distinction is useful when comparing structures along a path. Rather than concluding that “the molecule changed” from one measurement alone, you can ask two more focused questions: did its overall size change, and did its shape become less sphere-like or more sphere-like? The descriptors answer different aspects of the global-shape problem, so agreement or disagreement between their trends can guide your next inspection.
Build a plot around the group you care about
- Open the Path Analyzer.
- Select Asphericity as the observable.
- Choose the path you want to analyze.
- Define the atom-containing group whose shape matters for your question.
- Add a time series to follow the descriptor along the path, or add a histogram to inspect the range of sampled values.
The group selection is an important part of the analysis: the result describes the selected atoms, not automatically every feature of the molecular system. Choose a group that matches the question you want to answer. For instance, if you are interested in a particular molecular component, avoid treating a measurement on a broader selection as though it described that component alone.
Choose the view that matches the question
A time series is the natural starting point when you want to see how the shape descriptor varies along the path. It can help you locate portions where the value changes and compare those portions with the structural states you are investigating. A histogram answers a different question: what range of values appears in the sampled data? It summarizes the distribution, but it does not show where along the path a value occurred.
Neither view, by itself, explains the structural cause of a change. Treat the plot as a guide for further inspection rather than a complete interpretation. A shift in a global shape descriptor does not identify which atoms or interactions are responsible; return to the structure and examine the relevant part of the path.
Use complementary measurements
For a fuller picture of global shape changes, compare asphericity with radius of gyration and the shape parameter. These complementary observables can help separate a change in overall spread from a change in shape. Avoid relying on a single curve when the modeling question involves multiple aspects of molecular geometry.
In short: when size alone leaves you unsure whether a group’s shape has changed, add asphericity to the analysis. Choose the group deliberately, use a time series or histogram according to your question, and interpret the result together with other shape measurements.
Learn more in the Asphericity documentation.
Note: SAMSON and all SAMSON Extensions are free for non-commercial use. Get SAMSON.