



A molecular structure can look crowded without making it clear which neighbors are consistently close, or at what distances they tend to appear. This is a common challenge when examining solvation, ligand–pocket contacts, or the packing of selected residues across a molecular path. A radial distribution function (RDF) helps turn those pairwise distances into a curve that is easier to interpret.
An RDF asks a simple question: for two selected groups, how are the distances between their atoms distributed? Instead of inspecting every pair individually, it counts sampled pairs in distance ranges, or radial shells. The result is a one-dimensional curve against distance. Peaks indicate distances where pairs are more commonly observed in the sampled data; the curve can help reveal local structure and characteristic interaction distances.
Start with a useful comparison
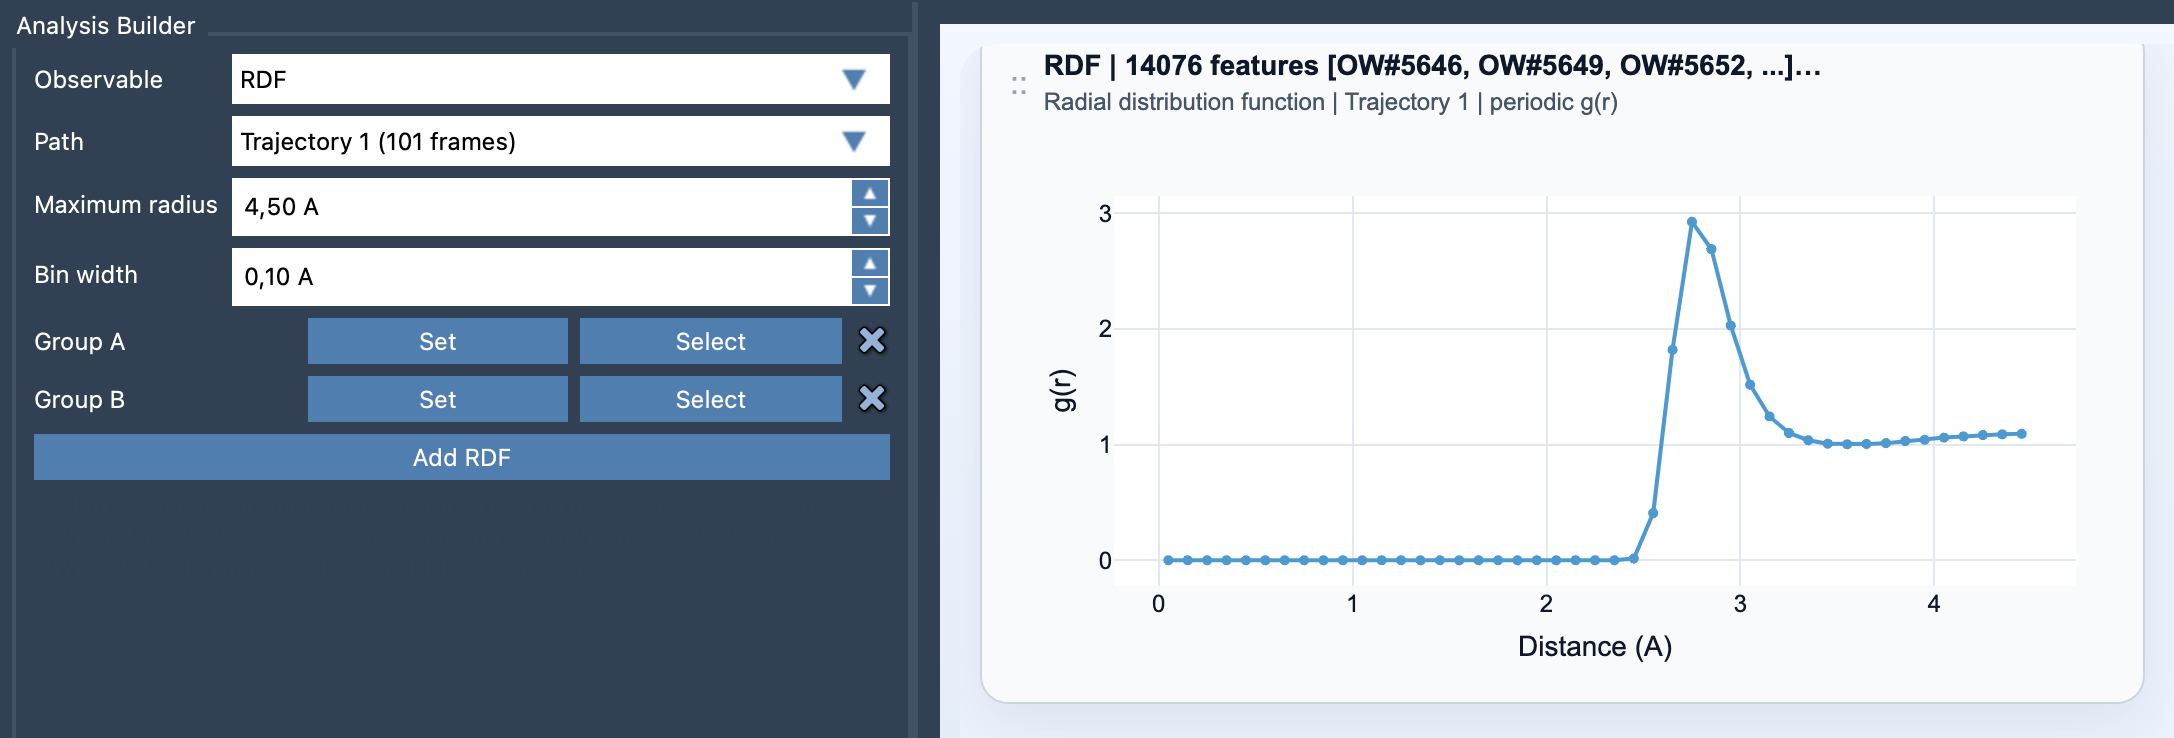
The curve is only as informative as the groups you choose. In Path Analyzer, select RDF as the observable, choose a path, and define Group A and Group B. Both selections must contain atoms. Give the groups a chemical purpose: for example, a ligand and its surrounding pocket, a solute and solvent, or two residue subsets. A clear question—such as “At what distances do solvent atoms occur around this group?”—makes it easier to decide whether the resulting curve answers anything useful.
Then set the maximum radius and bin width before clicking Add RDF. The maximum radius determines how far out distances are sampled. The bin width determines the radial resolution: narrower bins can distinguish nearby features, but may make the curve noisier; wider bins smooth the distribution, but can blur features together. There is no single best setting for every system. Choose a width that lets you see the feature you care about without mistaking fluctuations for meaningful structure.
Read the curve with its normalization in mind
At a basic level, the calculation counts how many sampled pairs fall within a shell around a distance r. The shell’s volume grows with distance—approximately 4πr²Δr for a thin shell—so raw counts at different radii are not directly comparable without accounting for that geometry. This is one reason normalization matters when interpreting an RDF.
When valid periodic unit-cell information is available, Path Analyzer can normalize the counts against the expected ideal-gas occupancy of each shell and report a properly scaled g(r). If periodic normalization is not possible, it instead shows an RDF-style curve in arbitrary units. That curve can still help you locate distance ranges where pairs are concentrated, but its vertical values should not be treated as a normalized probability or compared as though they were on the same scale as a properly normalized g(r).
In either case, a peak is a clue about recurring distances, not a complete explanation of why two groups interact. Interpret it alongside the molecular context and the exact atom selections. A curve for a chemically broad selection may combine several different kinds of contacts, making a feature harder to explain. Narrowing the groups to a meaningful subset can make the result more useful.
Keep the path-wide view in mind
RDF cards summarize the path globally; they are not linked to individual frames. This makes them useful for asking what distance patterns characterize the path as a whole, but they do not identify which frame produced a particular feature. If a system changes substantially along the path, a global summary may combine different structural situations. Treat the result as an overview of the sampled path, rather than a frame-by-frame account.
A practical checklist: define two atom-containing groups with a clear chemical meaning; choose a maximum radius that covers the distances relevant to your question; adjust bin width to balance detail and noise; and check whether the curve is normalized or in arbitrary units before comparing its height. These small checks make it easier to draw a careful conclusion from a distance distribution.
For the interface details and equations, learn more in the RDF documentation.
Note: SAMSON and all SAMSON Extensions are free for non-commercial use. Get SAMSON.