


Before running molecular simulations or refining homology models, it’s important to ensure your structure is sound. One common problem? Backbone conformations that fall into disallowed regions of a Ramachandran plot. These typically indicate strained residues, which can affect the stability and realism of simulations.
The Interactive Ramachandran Plot extension in SAMSON offers a visual and practical way to inspect and adjust dihedral angles of residues in protein structures. This blog post explains how you can explore individual residues directly from the plot—one of the fastest ways to identify and assess potential problems in protein models.
Interacting Directly with the Plot
After loading a protein structure (for example, PDB ID 1YRF) and opening the Interactive Ramachandran Plot app, the visualization provides a 2D map of φ (phi) and ψ (psi) dihedral angles for each residue in the protein.
Different tabs let you filter residue types—such as General, Glycine, Proline, and Pre-proline. Each dot in the plot represents one residue. The location of each dot indicates the backbone conformation, and its color signals whether it falls in an energetically favorable or unfavorable region (yellow for favorable, white for disallowed).
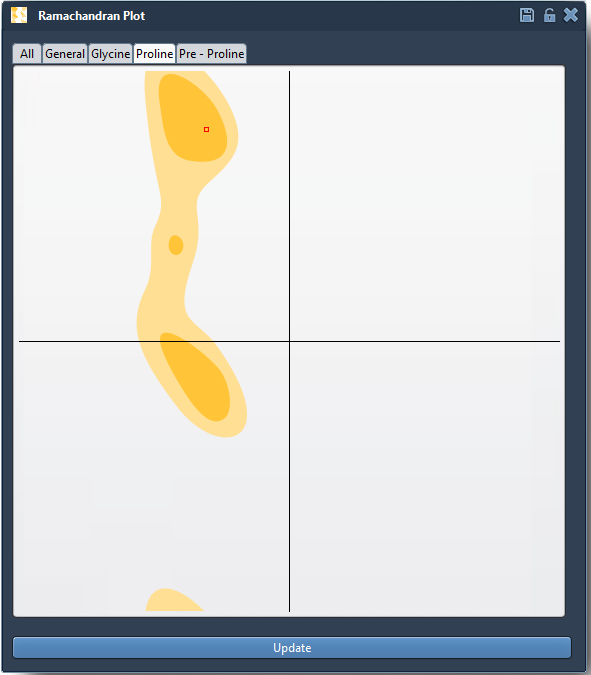
Click to Inspect
If a dot falls in a white area, it may be a candidate for refinement. You can simply click on any dot to immediately select the corresponding residue in the 3D viewport. This not only updates your structure visualization but also shows its precise φ and ψ angle values in the status bar:

Clicking lets you identify which residue may need a closer look, all without manually browsing residue lists or angle tables. This is particularly useful in larger systems where finding specific outlier residues can be time-consuming.
When and Why You’d Do This
Investigating residue placements using this approach is useful when:
- You want to validate experimental structures before simulations.
- Your homology model has unusual backbone angles to be corrected.
- You need to understand local flexibility in binding regions or loops.
The ability to click-and-locate makes residue validation much faster and intuitive, especially for users new to structural refinement workflows. And because the plot is updated live when editing angles (see the Interactive Editing section of the documentation), you can iteratively adjust and stabilize your model using visual feedback.
To learn more about all that the Interactive Ramachandran Plot can do, including live editing and integration with normal mode calculations, visit the full documentation at: https://documentation.samson-connect.net/tutorials/ramachandran/ramachandran-plot/.
SAMSON and all SAMSON Extensions are free for non-commercial use. To get started, download SAMSON at https://www.samson-connect.net.