


Tracking the motion of ligands during molecular simulations is often essential to understanding binding and unbinding mechanisms, but extracting meaningful insights from raw trajectory data can be time-consuming or visually unclear. If you’ve ever searched for a clear way to visualize the trajectory of a ligand—or any group of atoms—in a system, the Pathlines Extension in SAMSON might be just what you need.
By focusing on the movement of the center of mass (COM) of selected atoms along predefined paths, Pathlines turns complex motion data into intuitive visual models. This allows molecular modelers to quickly observe and interpret events like ligand unbinding, domain motions, or diffusive behaviors over the course of a simulation.
What You Can Learn from COM Pathlines
The COM of an atomic group (like a ligand or domain) serves as a useful metric to track its net motion without needing to analyze every individual atom. SAMSON’s Pathlines visual model enables you to:
- Follow ligand unbinding pathways derived from simulation or pathway analysis tools.
- Visualize structural rearrangements in proteins or complexes.
- Compare alternate pathways in parallel simulations.
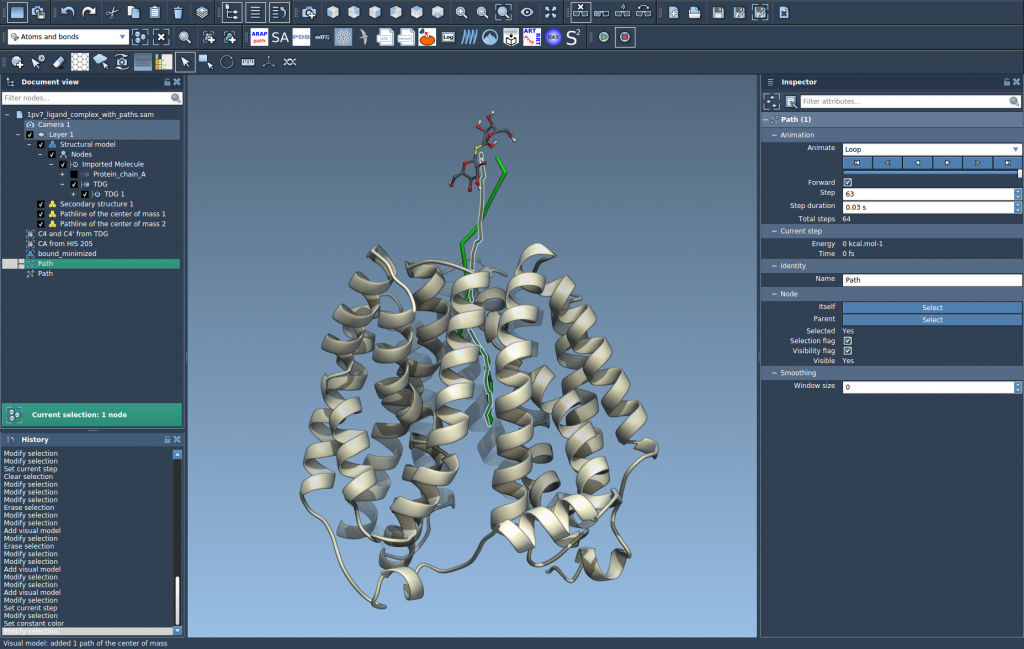
Try It: Visualizing Unbinding of Thiodigalactosid from Lactose Permease
To see Pathlines in action, you can start with a sample system provided in the documentation. Here’s what the process looks like:
1. Load the Sample System
In SAMSON, go to Home > Download and paste the following URL:
https://www.samson-connect.net/documents/046f1acd-c799-40f6-8185-cb4847eff795
This loads a structural model of Lactose permease with its bound ligand Thiodigalactosid (TDG), along with two precomputed unbinding paths generated using the Ligand Path Finder Extension.

2. Select Your Atoms and Paths
Switch to Document view, select the ligand TDG and one or both paths. If nothing is selected, the system defaults to using all atoms and paths in the document.

3. Generate the COM Pathline
To create a visual model of the COM movement:
- Go to Visualization > Visual model > More…, or use the shortcut Ctrl + Shift + V (or Cmd on Mac).
- Select Pathline of the center of mass and click OK.

This will draw a line showing the COM trajectory of TDG along the unbinding paths.

4. Explore and Customize
The resulting pathline is interactive and modifiable. In Document view and the Inspector, you can:
- Play/pause paths with double-click.
- Right-click for more path options.
- Adjust color and thickness of the visual model.

Why It’s Useful
Using visual models for COM trajectories helps simplify the analysis of complex motion. Instead of moving one frame at a time through a simulation trying to trace the ligand’s location, Pathlines shows you a full trajectory at once. This can help spot unexpected detours, compare binding pathways, or prepare explanatory visuals for publications.
You can learn more in the full documentation: https://documentation.samson-connect.net/tutorials/pathlines/pathlines/
SAMSON and all SAMSON Extensions are free for non-commercial use. You can get SAMSON at https://www.samson-connect.net.