


One of the recurring challenges in molecular modeling is making sense of complex atomic trajectories. Whether studying how a ligand unbinds from a protein or following large-scale conformational changes, analyzing raw coordinates can quickly become overwhelming. Fortunately, there’s a straightforward way in SAMSON to visualize what’s going on: Pathlines of the center of mass (COM).
Instead of manually parsing atomic displacements, the Pathlines visual model helps you focus on the global motion of selected groups of atoms by plotting their center-of-mass trajectory along a path. This visualization is particularly helpful when exploring ligand motion within a receptor or domain displacement in multi-subunit complexes.
What You’ll See With COM Pathlines
The idea behind COM pathlines is simple: you select a group of atoms, choose one or more predefined paths (for instance, ligand unbinding paths), and generate a visual trajectory showing how the center of mass moves over time.
This produces a clean and interpretable representation of the motion, like the one shown below:

How to Create a COM Pathline in SAMSON
Here’s a summarized walkthrough:
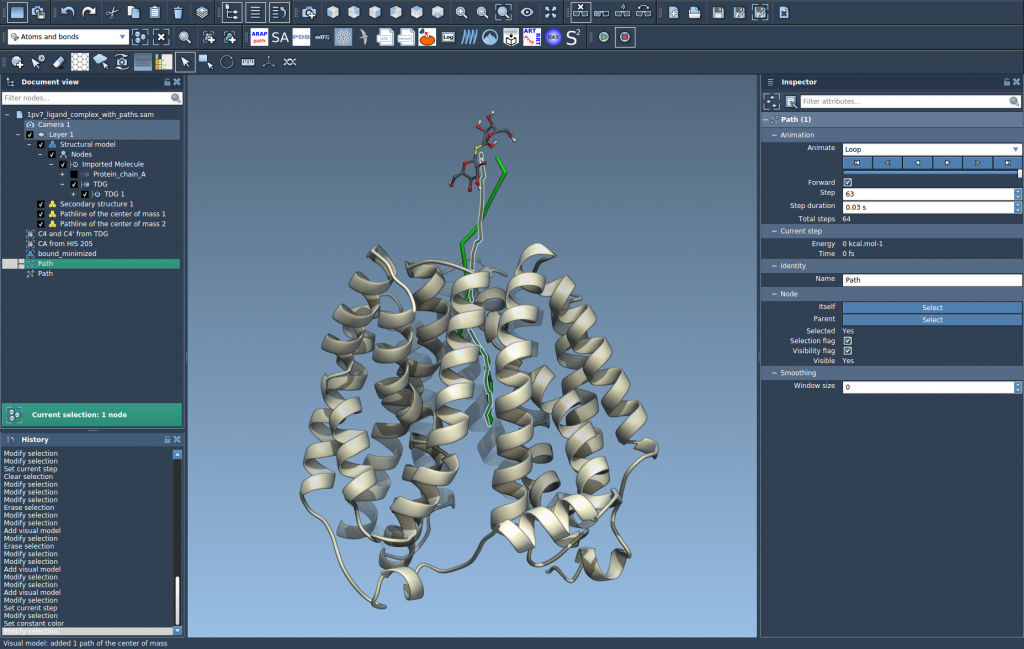
- Load a system with precomputed paths — such as the sample document provided in the tutorial, which includes the protein Lactose permease and the ligand Thiodigalactosid.
- Select atoms for which you want to track the center-of-mass (e.g., the ligand).
- Select path(s) the atoms will follow (e.g., different unbinding routes).
- Create the visual model:
Go toVisualization > Visual model > More..., choose Pathline of the center of mass, and hit OK.
And that’s it — you’ve now made a visual representation of where the selected group of atoms moved, reduced to a single, insightful curve.
Why This Matters
Visualizing COM motion is not just a cosmetic representation. It helps with:
- Identifying bottlenecks or key points in ligand unbinding pathways
- Simplifying complex dynamics into digestible insight
- Comparing multiple pathways of the same molecule under different conditions
- Saving time in post-processing trajectories
Customize and Refine
The visual model is not static. You can fine-tune the appearance directly in the Inspector: change the color, adjust the thickness, or alter other pathline attributes to better fit your analysis or presentation needs.

Pro Tip
If you’re analyzing several potential unbinding routes, you can generate multiple COM pathlines and overlay them for a comparative view — helping you identify which paths are more direct, curved, or exhibit looping behavior.
To learn more or go deeper into customizing visualizations, you can visit the full Pathlines tutorial at:
https://documentation.samson-connect.net/tutorials/pathlines/pathlines/
SAMSON and all SAMSON Extensions are free for non-commercial use. You can download SAMSON at https://www.samson-connect.net.