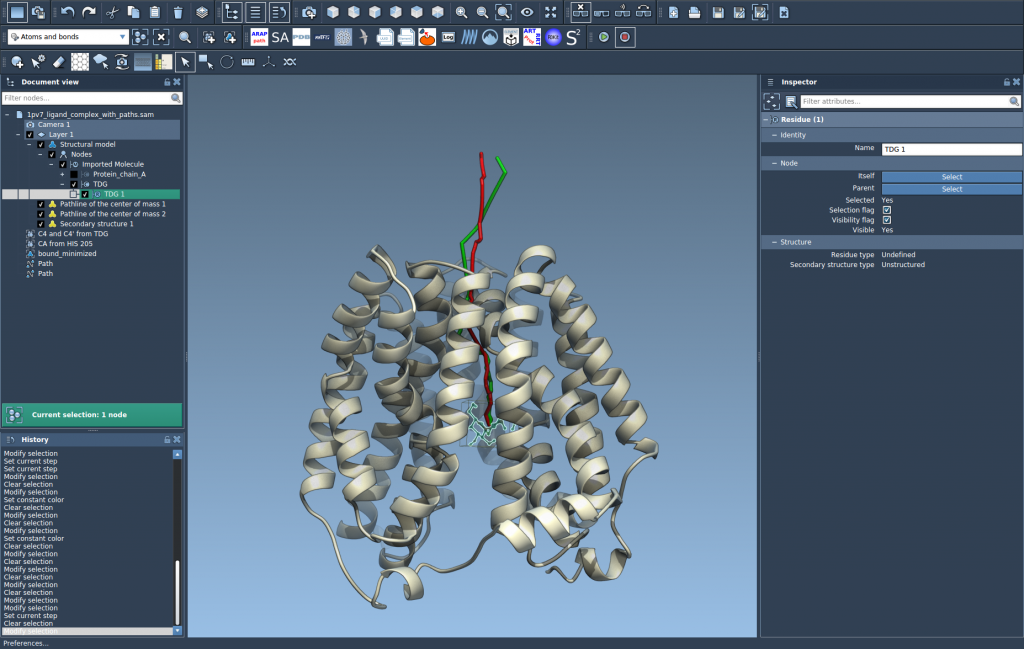
When studying molecular dynamics (MD) simulations of protein-ligand complexes, one common challenge is interpreting how a ligand moves during a binding or unbinding event. Especially in crowded systems or long trajectories, it can be hard to get a clear picture of atomic or group-level motion over time.
That’s where the Pathlines visual model in SAMSON comes in handy: it allows you to visualize the trajectory of the center of mass (COM) of a selected group of atoms (such as a ligand) along a user-defined path—created, for example, by a ligand pathfinding algorithm. This gives a quick, intuitive view of where your ligand is going, which tunnels it explores, and how its motion evolves throughout a simulation or along a reaction path.
When This Matters
If you’re trying to assess ligand unbinding, domain motion in a protein, or the movement of a molecule across a channel or membrane, tracking the COM can often offer a more manageable and meaningful trajectory than tracking hundreds of atomic positions. The visual compression of many atomic motions into a single pathline gives clarity, especially useful for presentation or analysis.
Try It in 3 Steps
Follow this quick workflow to set up COM pathlines using the Pathlines Extension in SAMSON:
- Select your atoms and paths
In the Document view, highlight the atoms you’re interested in (e.g., a ligand), and select one or more paths. If you’re working with outputs from an extension like Ligand Path Finder, you’ll already have candidate paths in the structure. - Create the visual model
Go to Visualization > Visual model > More… (or use shortcut Ctrl/Cmd + Shift + V), then choose Pathline of the center of mass. - Explore the resulting trajectory
You’ll now see a clear line tracing the COM displacement along the selected path(s). You can tweak the display (color, thickness) using the Inspector to make the visualization match your needs.

This creates a streamlined view of motion, which is particularly useful when demonstrating ligand unbinding processes or identifying whether alternative exits or entry tunnels are used.

Going Further
Once you’ve visualized COM motion, you can refine the underlying path using optimization tools like the P-NEB app. But even without optimization, seeing COM pathlines opens up better quantitative and qualitative analysis.
To learn more, visit the full tutorial: Pathlines tutorial.
SAMSON and all SAMSON Extensions are free for non-commercial use. This makes it accessible for academic and research purposes with no cost.


