In molecular simulations, the Potential of Mean Force (PMF) is a valuable tool to quantify free energy profiles along a reaction coordinate. Whether you’re studying ligand binding, ion transport, or conformational changes, accurately computing the PMF is crucial to extract meaningful insights from your molecular system.
But there’s a catch many modelers encounter: poor coverage of the reaction coordinate space. If your sampling is uneven or incomplete, your PMF results can be misleading or inconclusive, and it may not be obvious where the issue lies. This is where the WHAM analysis in GROMACS Wizard becomes highly useful.
What is WHAM and why coverage matters
The Weighted Histogram Analysis Method, or WHAM, combines the results of multiple biased simulations (typically from umbrella sampling) to compute a statistically optimal estimate of the PMF. However, WHAM can only give reliable results if the input windows sufficiently overlap and well sample the reaction coordinate space.
A common pain point for simulation practitioners is realizing after the fact that their sampling was insufficient—wasting time, CPU hours, and potentially misinterpreting results. The good news: GROMACS Wizard helps avoid this scenario early on by visualizing PMF and histogram data side by side.
Visualizing coverage in GROMACS Wizard
Once you’ve completed your umbrella sampling steps (which may be done via batch computations), head over to the WHAM Analysis tab in GROMACS Wizard. You can auto-fill your project folder if it’s a continuation from the umbrella sampling step:
![]() Auto-fill saves time when switching between steps.
Auto-fill saves time when switching between steps.
From there, the wizard reads your reaction coordinate settings, simulation times, and temperature. Choose the reaction coordinate, adjust parameters if needed (time range, energy units, bounds), and click Compute.

Interpreting the histogram
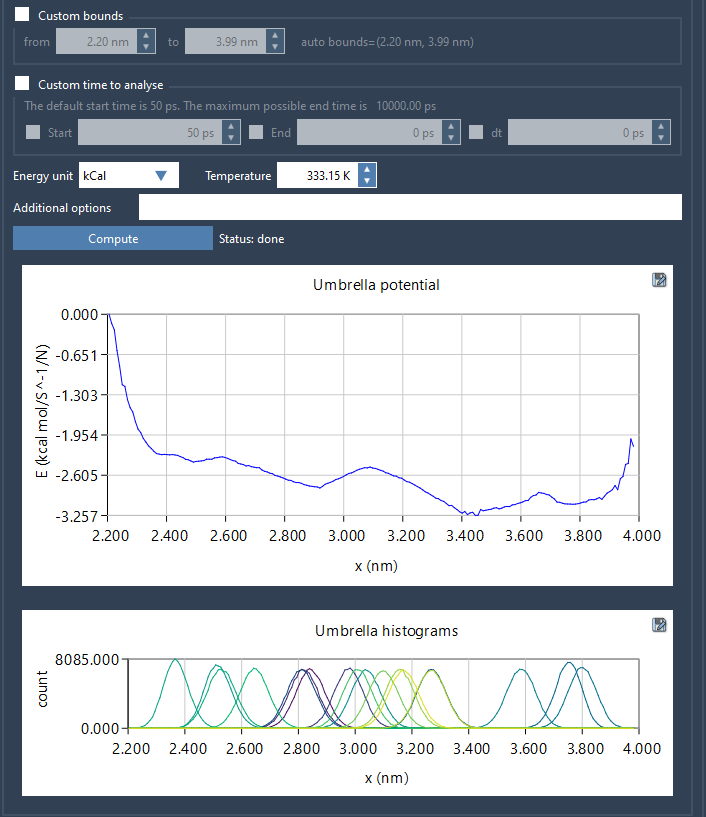
After calculation, you’ll see two graphs: the PMF and a histogram. The histogram is more than just extra output—it’s a diagnostic tool. It shows how well different regions of the reaction coordinate are sampled. Peaks in the histogram correspond to well-sampled regions, while dips or gaps indicate poor coverage.
By inspecting the histogram early, you can decide whether to run additional windows to improve overlap. It’s a practical way to “debug” your enhanced sampling without relying solely on metrics embedded in scripts or needing post-processing tools.
Additionally, computed results are saved in a dedicated wham_results folder, so switching between coordinates or tweaking parameters reuses existing outputs when possible—speeding up analysis iterations.
A helpful strategy
If reaction coordinate coverage is a recurring pain point in your simulation workflow, using histogram visualization in GROMACS Wizard’s WHAM analysis can provide immediate feedback and guide simulation decisions. It’s an efficient way to ensure you’re getting the most out of your sampling—before spending more time on runs that won’t improve your results.
Learn more about PMF analysis with WHAM in GROMACS Wizard.
SAMSON and all SAMSON Extensions are free for non-commercial use. You can get SAMSON at https://www.samson-connect.net.


