


When working on molecular modeling, understanding the movement of groups of atoms within a system is essential. Detecting regions of significant activity or quiet periods in a molecular trajectory can unlock better insights into your system’s behavior. This is where SAMSON’s Average Velocity analysis within the Path Analyzer becomes a helpful ally for researchers.
What is Average Velocity Analysis?
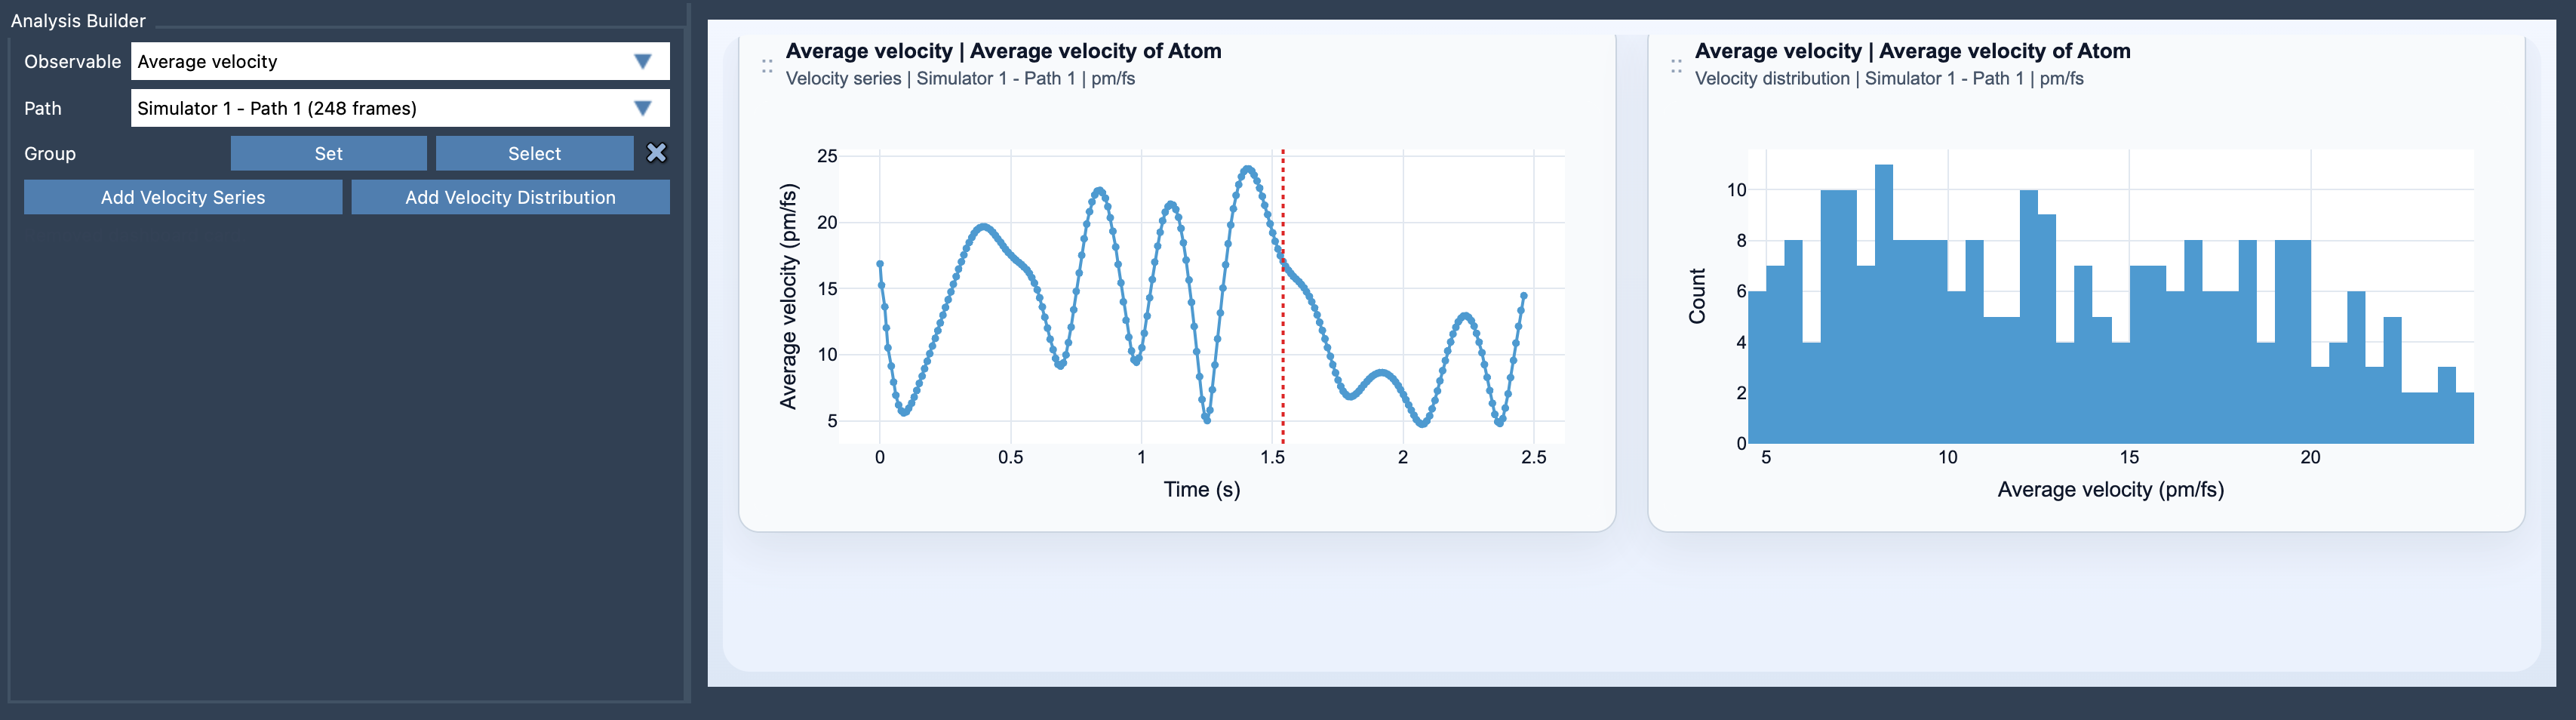
The Average Velocity analysis calculates the mean velocity magnitude of a selected atom group along a defined path. Its primary function is to help spot bursts of motion within dynamic simulations or identify where the system exhibits minimal activity. This makes it a useful tool for analyzing dynamical trajectories in molecular modeling and simulating real-world processes like molecular vibrations or interactions.
For researchers, this can lead to detecting anomalies, providing insights into important dynamics, or identifying critical conformational changes. For instance, are there specific regions in a trajectory where higher velocities indicate potential conformational switches? Are there segments of low motion indicating structural stability?
How to Add the Average Velocity Plot
Adding an Average Velocity plot in SAMSON is straightforward. Here’s how it works:
- Open the Path Analyzer tool.
- Select the Average Velocity observable.
- Choose a Path that contains velocity data.
- Specify the Group of atoms you wish to analyze.
- Click either Add Velocity Series for a time-series visualization, or Add Velocity Distribution to inspect the distribution of velocity magnitudes.
The two visualization options, Velocity Series and Velocity Distribution, provide different perspectives on your data:
- Velocity Series: This plot follows the mean velocity magnitude of a group along its path, giving you a timeline of the group’s motion.
- Velocity Distribution: This lets you explore how the velocities are distributed for the group, helping to identify outliers or dominant velocity trends.
Practical Considerations
To get started, you’ll need to select one atom-containing group and ensure that the chosen path exposes velocity data for the selected atoms. Units for the analysis can also be customized after plot creation, allowing you to switch between Auto, pm/fs, A/ps, and m/s units depending on your preferred conventions.
Benefits of Average Velocity Analysis
This type of analysis can not only help spot high-activity regions but also let you correlate motions with forces. For example, comparing the Average Force analysis alongside Average Velocity data lets you understand how driving forces relate to the observed motions. This connection can be critical for understanding molecular mechanics or designing molecular interventions.
By visualizing velocity distributions and time series, researchers can ensure simulations align with expectations or uncover unexpected dynamics for further exploration. It’s a powerful diagnostic tool for comparative and exploratory studies in structural biology, drug discovery, and materials science.
Key Equation
For those interested in the mathematical underpinnings, the average velocity for a selected atom group A at any given frame t is computed as:
Here, it calculates the sum of magnitudes of individual atom velocities, averaged over the number of atoms in the group. This approach ensures a comprehensive representation of motion dynamics along the specified path.
Conclusion
The Average Velocity analysis in SAMSON significantly simplifies the process of exploring molecular motion in simulations. Whether you’re detecting bursts of molecular activity or examining regions of structural stability, this tool provides a reliable and informative lens for trajectory analysis.
Learn more about how to use the Average Velocity in SAMSON by visiting the documentation page.
Note: SAMSON and all SAMSON Extensions are free for non-commercial use. You can get SAMSON here.