Understanding the interactions between a protein and its ligand is essential in molecular modeling and drug discovery. But when analyzing complex 3D molecular structures, sometimes seeing what matters most—key interactions—can get visually overwhelming. If you’ve ever felt like you needed to untangle the spaghetti of 3D structures to make sense of your binding pocket, you’re not alone.
SAMSON’s Interaction Designer offers a way to auto-generate meaningful 2D interaction diagrams that stay synchronized with the corresponding 3D molecular models. This means you can clarify crucial binding interactions—without losing track of spatial relationships in 3D.
Precise insight through automatic 2D diagrams
With a single command—Home > Diagram—you can automatically create a complete 2D diagram based on your current selection or the whole structure. This feature is particularly helpful for those analyzing binding pockets in protein-ligand complexes. The diagram highlights interacting atoms, shows the binding region, reveals solvent exposure, and displays residues involved in molecular interactions.

Main features that facilitate your work
- Integrated 2D–3D view: Selecting or zooming into atoms in either 2D or 3D updates both views. This bi-directional link ensures consistent navigation.
- Binding pocket visualization: Clearly see the pocket and its surrounding environment to focus on what affects ligand binding.
- Solvent accessibility: Evaluate how exposed ligand atoms are to the surrounding solvent.
- Interacting residues and groups: Get a clear visual breakdown of the interacting amino acids and functional groups with support for a wide range of interactions.
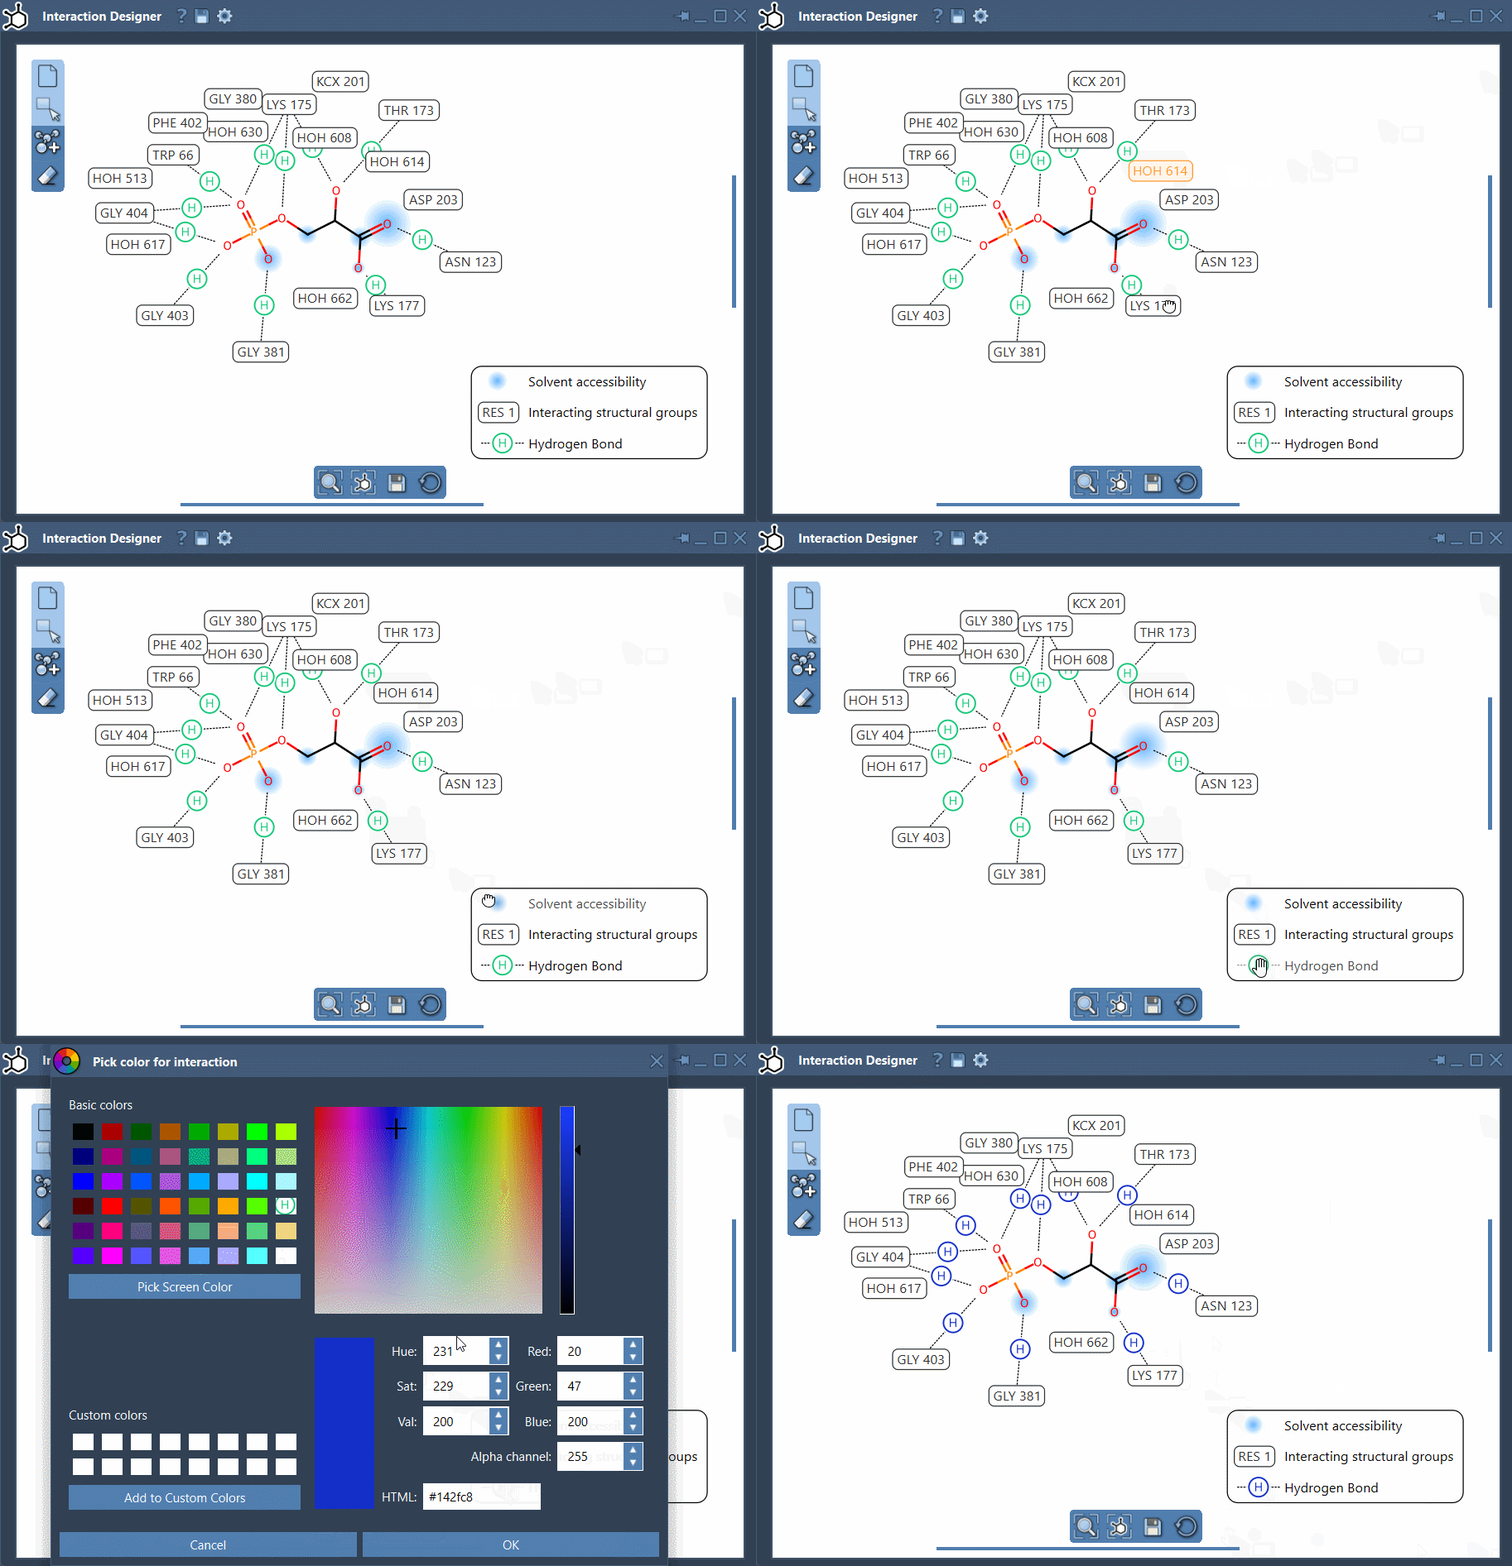
- Custom layout: Rearranging labels and interaction symbols is straightforward. You can also hide or recolor specific interaction types by customizing the diagram legend.

Supported interactions at a glance
The Interaction Designer detects a comprehensive selection of interatomic interactions, including hydrogen bonds, hydrophobic interactions, halogen bonding, and aromatic π-π stacking. More specialized cases like carbon-π, cation-π, and amide-π contacts are also supported. This makes it highly effective for analyzing systems ranging from small molecule inhibitors to large protein complexes.
A few practical tips
- Use the bottom menu to align 2D and 3D views for a clearer spatial understanding.
- Zoom in/out with
Ctrl/Cmd+ mouse scroll. Move your diagram easily by holding the middle and right mouse buttons simultaneously.
A short tutorial clip if you prefer visuals
Want a quick overview? This excerpt from the SAMSON 2025 webinar walks you through how to create and edit these interaction diagrams effectively:
Being able to toggle from a clear symbolic 2D view to an immersive 3D structure offers a balance between interpretability and spatial insight for interaction analysis.
To learn more, visit the Interaction Designer documentation page.
SAMSON and all SAMSON Extensions are free for non-commercial use. You can download the platform at https://www.samson-connect.net.


