


Efficiently modeling proteins requires understanding their backbone conformations. This can be especially tricky when dealing with strained residues or outliers that don’t conform to expected dihedral angle distributions. Enter the Interactive Ramachandran Plot, a powerful feature in SAMSON that not only helps you visualize allowed regions of φ (phi) and ψ (psi) dihedral angles but also lets you refine protein structures interactively.
What is the Ramachandran Plot?
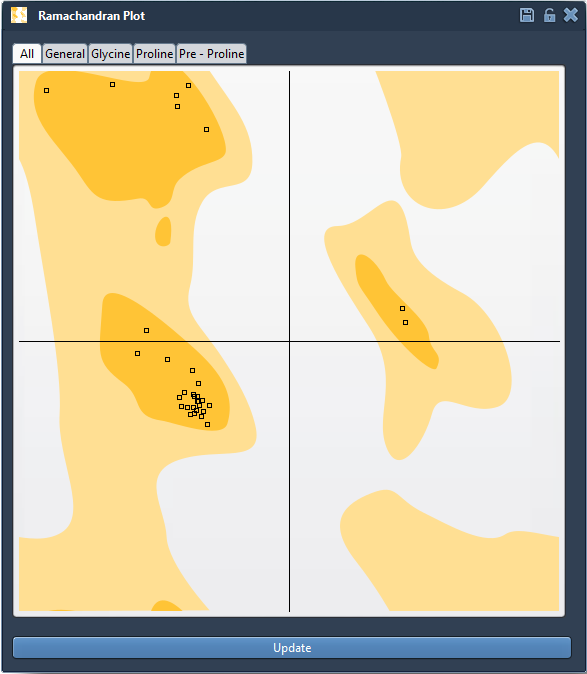
The Ramachandran plot is a fundamental tool for visualizing the energetically allowed regions of backbone dihedral angles in amino acid residues. By plotting ψ vs. φ, you can identify favored and disallowed conformations based on steric and energetic constraints. This insight is crucial for detecting strained regions in protein structures.
In the plot:
- Yellow areas represent energetically favorable conformations.
- White areas show unfavorable ones.
Strained residues often fall outside the yellow regions and might require adjustments to bring them into energetically favorable states.
How to Use the Interactive Ramachandran Plot
Let’s walk through key features of the Interactive Ramachandran Plot in SAMSON.
1. Opening the Ramachandran Plot App
To access the app:
- Launch the SAMSON platform.
- Navigate via Home > Apps > Biology > Ramachandran plot.
- Load your protein structure and click Update to generate the Ramachandran plot.
The resulting visual categorizes all residues, letting you see their conformations at a glance.
2. Filtering and Visualizing Residues
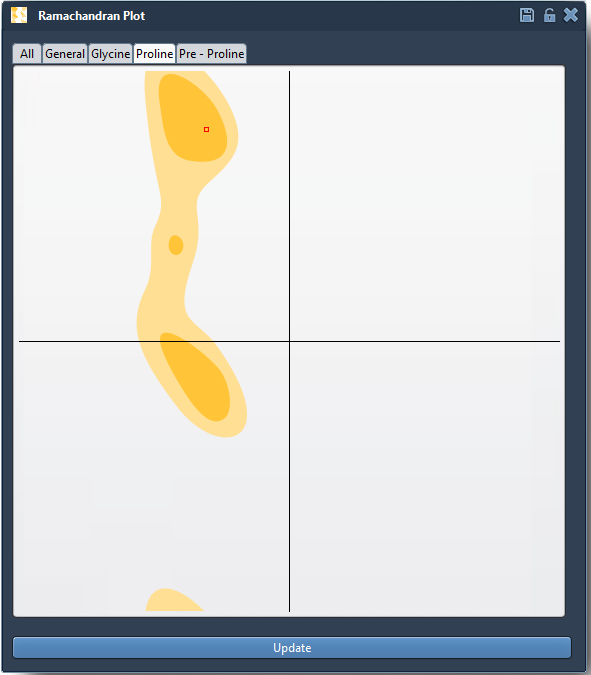
The app offers filtering tabs to simplify your workflow:
- All: Displays all residues.
- General: Showcases residues apart from glycine, proline, and pre-proline categories.
- Glycine: Focus on glycine residues.
- Proline: For residues with specific constraints due to their cyclic structure.
- Pre-proline: Residues immediately preceding a proline.
You can click individual points on the plot to select residues in your 3D structure. Details like φ and ψ angles will appear in the status bar, making it simple to track and analyze specific residues.
3. Making Adjustments: Interactive Editing
One of the standout features of this tool is its interactivity. You can adjust dihedral angles and see real-time updates in your structure. Here’s how:
Option 1: Drag Directly in the Plot
- Select a residue on the plot and drag its point to a new location. The 3D structure updates instantly.
- If the result isn’t satisfactory, undo the changes using Ctrl/Cmd + Z.
Option 2: Use the Twister Editor
- Select the Twister Editor from the left-hand menu in the viewport.
- Twist the protein in 3D space and observe how the Ramachandran plot updates dynamically.
Why This Matters
By allowing you to both inspect and refine protein conformations, the Interactive Ramachandran Plot significantly enhances the quality of your molecular models. You can:
- Detect strained residues before running simulations, saving time and resources.
- Refine homology models and minimize backbone outliers for more accurate predictions.
- Improve understanding of flexibility in active or binding sites.
Start Exploring Today
The Interactive Ramachandran Plot exemplifies how SAMSON bridges visualization and local adjustments seamlessly. Whether you’re refining a structure or preparing for docking and simulation studies, this tool makes your workflows more efficient and intuitive.
To learn more, visit the full documentation page at this link.
SAMSON and all SAMSON Extensions are free for non-commercial use. Start refining your models today by downloading the platform at SAMSON Connect.