


If you’ve ever run a molecular dynamics simulation only to encounter unexpected behavior, there’s a good chance you’re not alone. While energy minimization and restraints can catch many issues, a far more visual—and proactive—tool can help with one common modeling pitfall: strained backbone dihedral angles.
When designing or refining protein structures, especially in homology modeling or loop fitting, a few residues may take on geometries that are not energetically favorable. These might pass unnoticed until a simulation fails, or worse, yields unreliable results.
The Interactive Ramachandran Plot Extension in SAMSON offers an intuitive way to catch and fix these problems early on. This visual tool allows you to see the position of each residue in φ (phi) vs. ψ (psi) space, color-coded by whether their configurations are energetically allowed or not.
What Should You Look For?
In an ideal scenario, residues should fall within the yellow areas of the plot, which represent sterically allowed regions. White areas, on the other hand, indicate disallowed conformations—red flags for downstream processes.
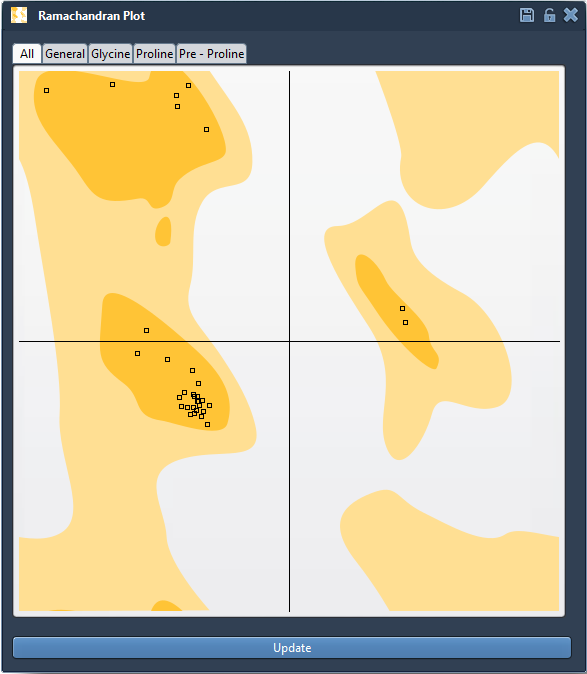
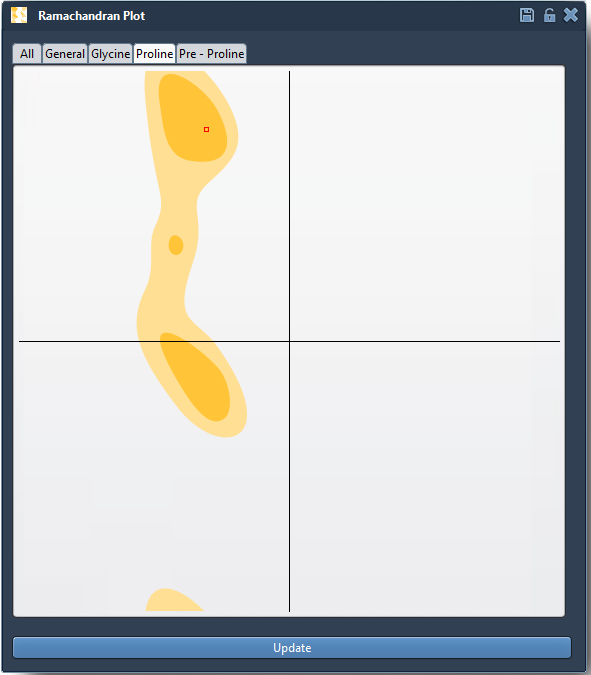
The app lets you filter residues by type (General, Glycine, Proline, Pre-Proline), allowing you to focus on the relevant geometry classes depending on your structure. This is crucial, as glycine and proline have very different conformational behavior compared to other amino acids.
Explore and Diagnose
Clicking on a residue’s dot in the plot instantly selects it in the 3D viewport and displays its φ and ψ values in the status bar. This lets you easily connect a bad point in the plot to an actual structural issue in your protein model.

For instance, if you suspect a loop region is problematic, simply isolate that domain, bring up the Ramachandran plot, and start clicking. You’ll be surprised how often strained residues hide in plain sight.
When to Use This Tool
- Before simulation: Catch residues in disallowed regions before you waste hours on a run.
- After homology modeling: Refine angles in newly built regions such as loops or termini.
- In functional studies: Understand local flexibility around an active site or hinge region.
By combining visual analysis and interaction, this tool enables users to refine structures logically and iteratively—without blindly relying on minimization or restraints.
To get started, open a protein (for example, PDB ID 1YRF using the Fetch function), then navigate to Home > Apps > Biology > Ramachandran Plot within SAMSON. Hit Update in the app to generate the interactive plot, and start exploring. Try filtering by residue type to see how behavior changes across glycine, proline, etc.
If you’re editing or refining structures regularly, integrating Ramachandran plot checks into your workflow could save time—and help avoid simulation errors later on.
Learn more in the full documentation.
SAMSON and all SAMSON Extensions are free for non-commercial use. You can download SAMSON at https://www.samson-connect.net.