



Refining protein structures is a critical step in molecular modeling workflows. Strained residues or outliers in your protein backbone can lead to inaccuracies in simulations, docking studies, and other downstream analyses. This is where the Ramachandran Plot shines – it allows you to visualize and fine-tune backbone dihedral angles (φ and ψ) with precision. In this blog post, we’ll dive into the essentials of using the Interactive Ramachandran Plot in SAMSON to inspect, refine, and perfect your protein models.
What is a Ramachandran Plot?
A Ramachandran Plot maps the energetically permissible conformations of backbone dihedral angles ψ (psi) vs. φ (phi) in amino acid residues. These plots highlight favored regions (where conformations are stable and energetically favorable) and disallowed regions (where steric clashes or energetic issues arise). This makes it a vital tool for pinpointing and correcting outliers in protein structures.
Visualizing a Protein Structure
Before you start editing conformations with the Ramachandran Plot, you’ll need a protein structure to work with. You can load one in SAMSON by following these steps:
- Open Home > Fetch in SAMSON.
- Input your desired Protein Data Bank ID (e.g.,
1YRF) in PDB or PDB (mmCIF). - Click the corresponding Load button and you’re all set!
Once you have your protein loaded, you’re ready to launch the Interactive Ramachandran Plot to explore its backbone conformations in detail.
Interactive Refinement with the Ramachandran Plot
The Interactive Ramachandran Plot in SAMSON allows you to directly inspect and edit specific residues by interacting with the plot. Here’s how it works:
Step 1: Open the Ramachandran Plot App
Go to Home > Apps > Biology > Ramachandran Plot in SAMSON, and click on Update to generate a Ramachandran Plot for your loaded structure. Depending on the structure, you’ll see:
- Yellow areas representing energetically favorable conformations.
- White areas signifying unfavorable conformations.
Your residues will be plotted as individual points overlaying these regions.
Step 2: Select and Inspect Residues
Click on any point on the plot, and the corresponding residue will be highlighted in the 3D viewport. You will also see the dihedral angles (φ and ψ values) displayed in the status bar at the bottom:

This makes it easy to focus on outliers that might require adjustment and ensures your edits are specific and controlled.
Editing Conformations
Once you’ve identified a residue that needs refinement, you can edit its conformation interactively using one of the following methods:
Option 1: Drag Directly in the Plot
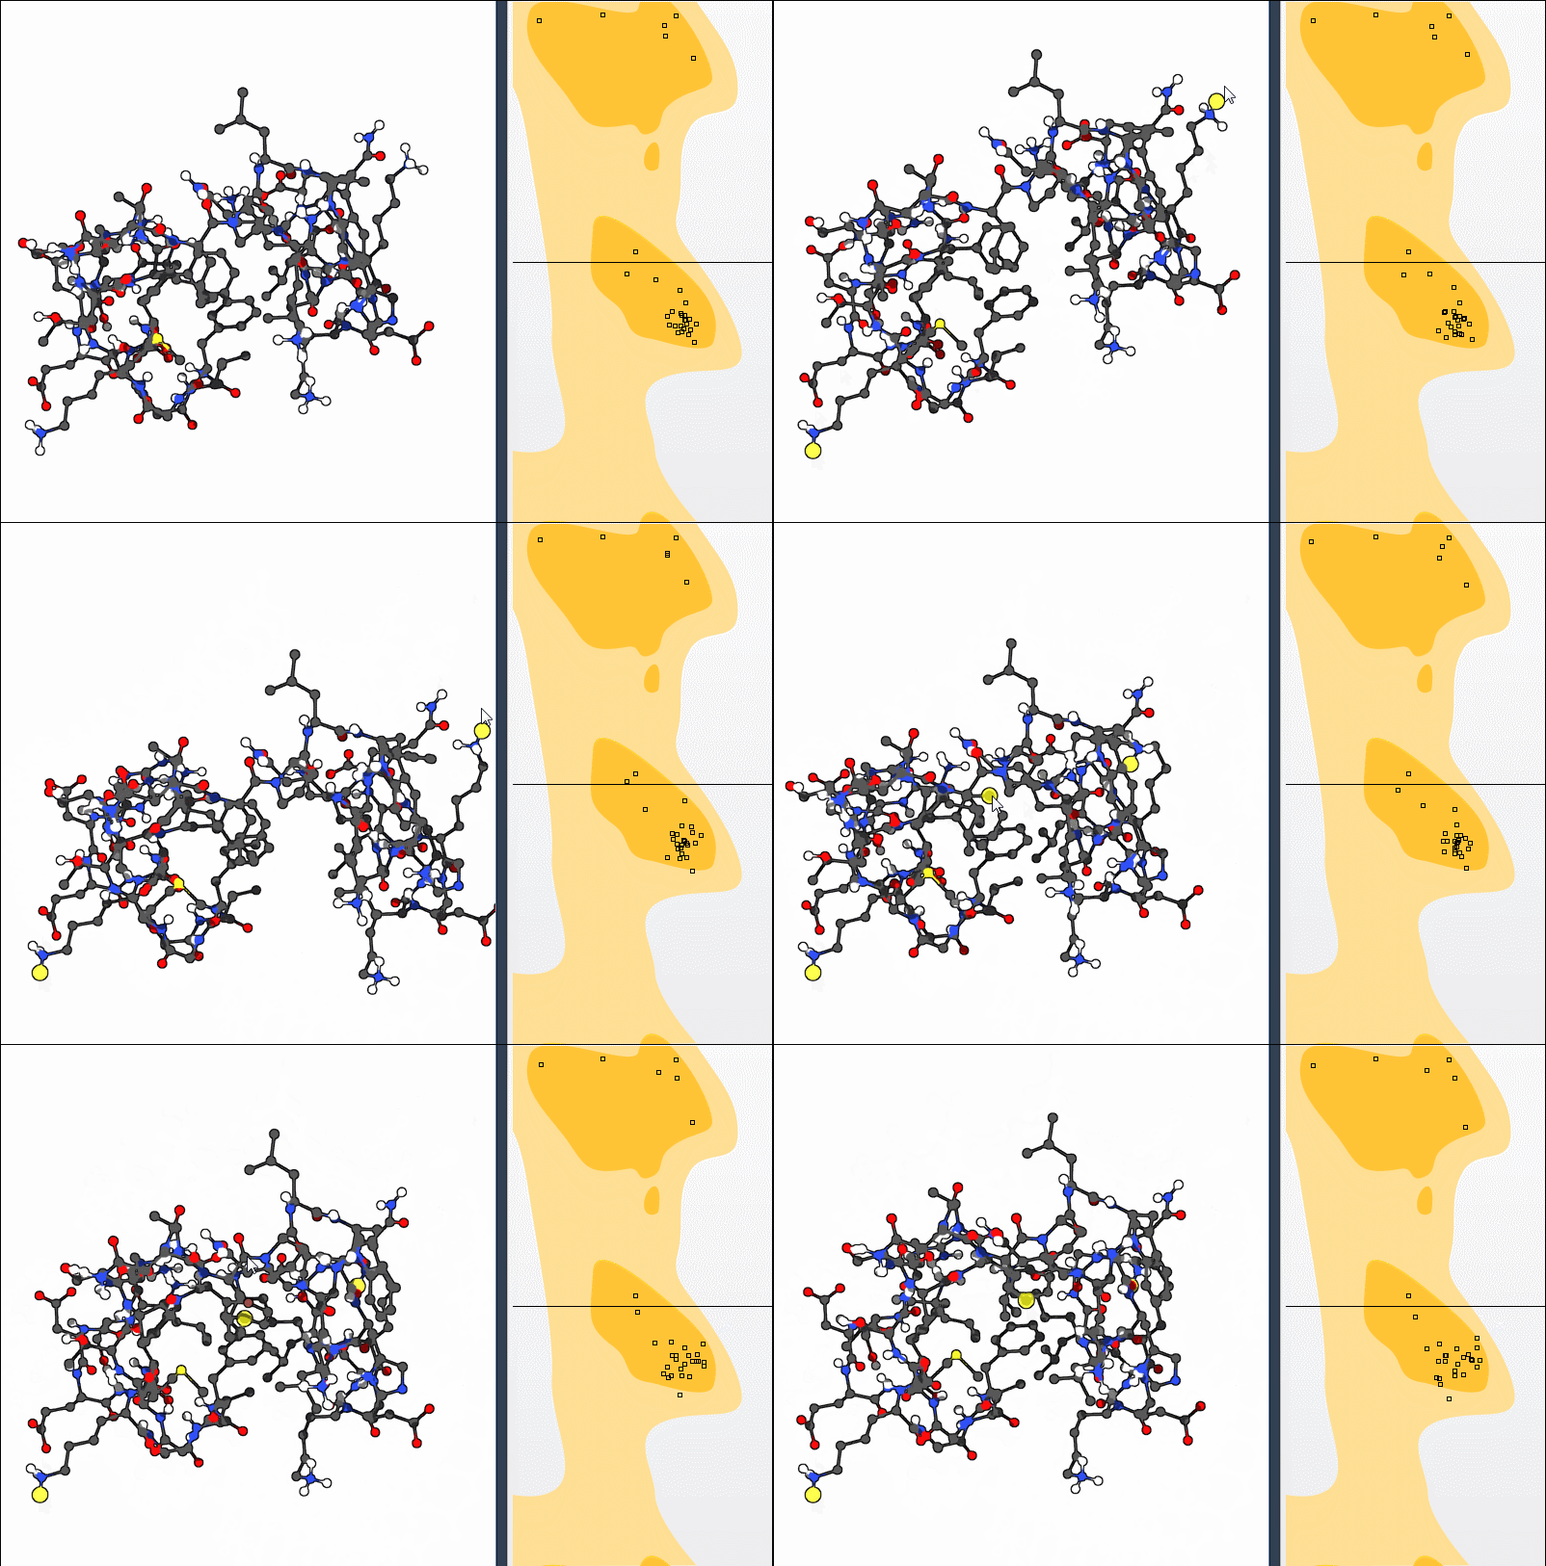
- Select the residue in the Ramachandran Plot and drag the corresponding point to a favored region.
- This will update the dihedral angles in real-time, and you’ll see the changes reflected immediately in the 3D structure.
- If needed, undo your changes by pressing Ctrl/Cmd + Z.
Option 2: Use the Twister Editor
You can also use the Twister Editor available in the viewport:
- Select the Twister Editor from the left-hand menu.
- Twist a specific part of the structure in 3D space and watch as the dihedral angles are adjusted live in the plot.
Applications in Protein Modeling
The Ramachandran Plot is particularly useful for:
- Identifying and fixing strained residues before running molecular dynamics simulations.
- Refining homology models by addressing outlier conformations.
- Exploring conformational flexibility in binding or active sites.
With its combination of visualization and interactive editing capabilities, this tool integrates seamlessly into any workflow requiring protein refinement.
Ready to optimize your protein structure? Explore the full tutorial on the Ramachandran Plot in SAMSON’s documentation here.
Note: SAMSON and all SAMSON Extensions are free for non-commercial use. Download SAMSON today at SAMSON Connect.