



For molecular modelers, tracking the intricate movement of specific atom groups, ligands, or residues within complex systems is often a challenging but essential task. Understanding these motions is critical for analyzing ligand unbinding, protein conformational changes, or diffusion processes. To address this need, SAMSON’s Pathlines visual model provides an intuitive way to visualize the center-of-mass (COM) motion of selected atom groups along specified paths.
Why Use Pathlines?
If you’ve ever struggled to keep track of collective domain movements, ligand binding/unbinding dynamics, or diffusion pathways, the Pathlines tool can provide much-needed clarity. Pathlines create a visual representation of the COM motion along a path, helping researchers identify important details like displacement trends or trajectory deviations. This is especially useful when investigating molecular mechanisms or optimizing transition paths in reaction coordinates.
Getting Started: The Essentials
Before diving into creating pathline visualizations, here’s what you need:
- Log into SAMSON Connect.
- Install the Pathlines Extension.
- Restart SAMSON to ensure the extension is active.
- Optionally, download the sample system (a structural model of Lactose permease with ligand Thiodigalactosid) from this link.

Creating Pathlines: A Step-by-Step Guide
1. Select Atoms and Paths
In the Document view, select the atoms and paths you want to focus on.
- Use the Ctrl / Cmd key to select multiple nodes.
- If no paths or atoms are selected, the entire document will be used as the default input.

2. Create the Visual Model
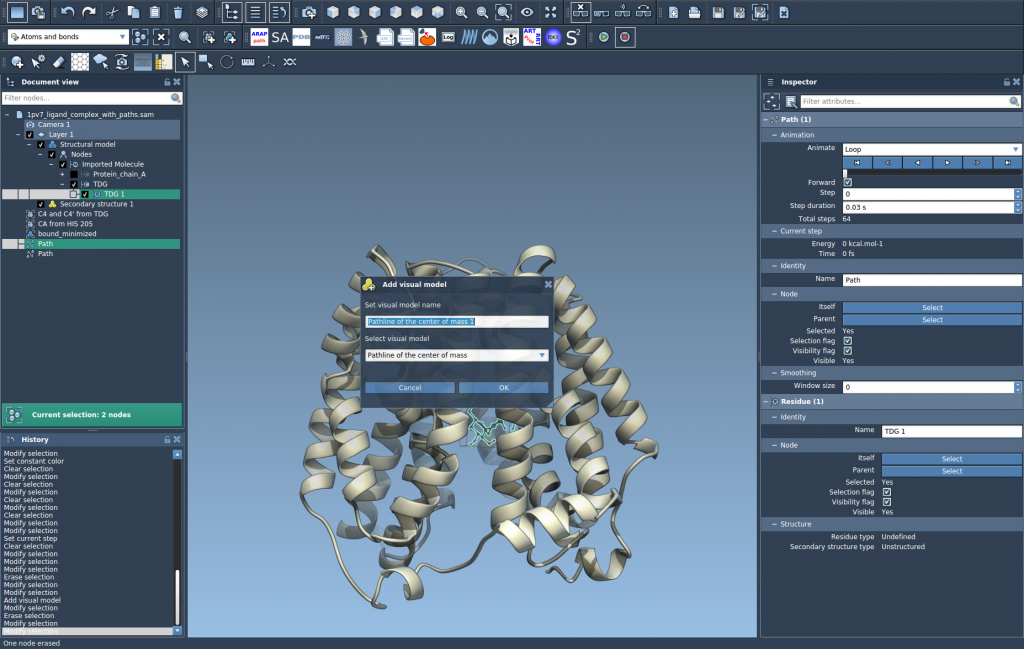
Go to Visualization > Visual model > More… or use the shortcut Ctrl/Cmd + Shift+V. In the dialog that appears, select Pathline of the center of mass and click OK.
3. Explore and Customize Your Visualization
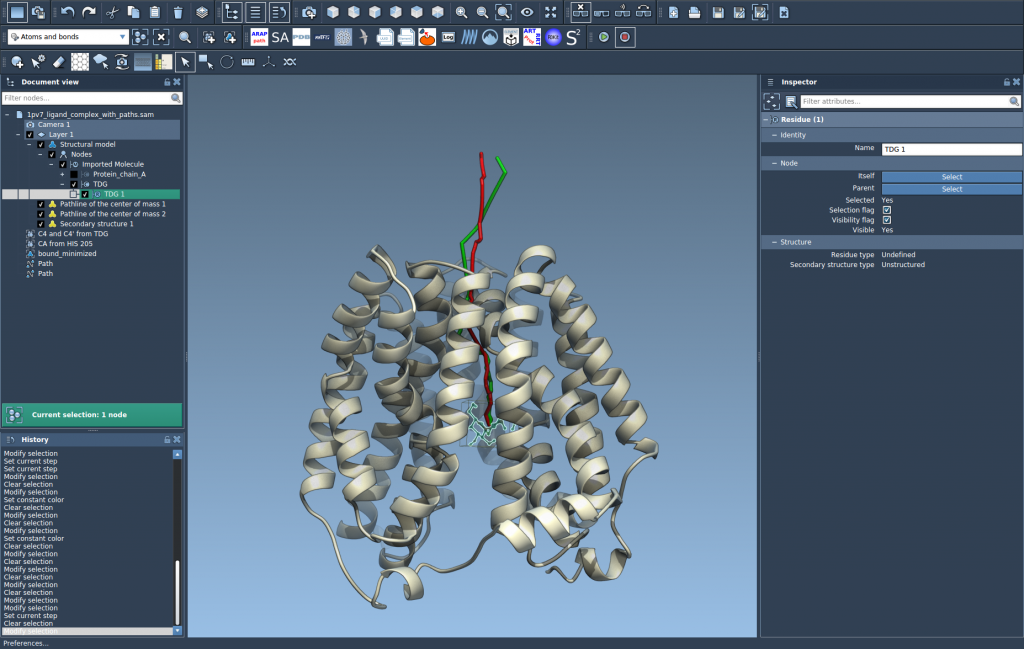
The created pathline will now visually map the COM motion of the selected atoms along the specified paths. You can explore the motion by double-clicking on paths in the Document view to start or stop them. Right-click on paths to access additional context menu options like path controls.
To fine-tune the visualization, open the Inspector (Ctrl/Cmd + 2) and adjust attributes such as color and thickness.
4. Deleting or Modifying Input Data
Keep in mind that deleting a path or atoms associated with the pathline will affect the visualization. It’s good practice to double-check your selections before applying major changes.
Applications of Pathlines
- Mapping ligand unbinding/rebinding routes.
- Analyzing collective domain motions in proteins.
- Visualizing molecular behavior for reaction coordinate workflows.
Conclusion
The Pathlines visual model provides molecular modelers an efficient and straightforward approach to comprehending COM motion in complex systems. It simplifies the often-daunting task of deciphering molecular pathways in dynamic simulations.
To delve into further details and advanced applications, visit the official Pathlines tutorial.
SAMSON and all SAMSON Extensions are free for non-commercial use. Get SAMSON at https://www.samson-connect.net.