



Understanding molecular behavior often boils down to analyzing how different groups within a molecule or different molecules interact through space. Whether it’s monitoring contacts, determining how binding sites open and close, or observing motion between domains, analyzing distances over a trajectory is fundamental to insights in molecular modeling. The Path Analyzer in SAMSON provides a robust way to perform such analyses, allowing you to track distances between two groups with precision and flexibility.
Why Use Distance Analysis?
Distance analysis is essential for tracking and understanding molecular interactions. Here are some common use cases:
- Tracking the approach of two chemical groups to study binding interactions.
- Monitoring structural transitions such as domain motion or protein folding paths.
- Determining changes in proximity, such as binding-site opening and closing during ligand entrance or exit.
The Distance tool in SAMSON offers different methods to measure distances, ensuring that users can tailor the level of analysis to their needs.
Methods of Distance Measurement
The flexibility of the Distance tool lies in the several measurement modes it supports:
- Centroids: This mode reduces each group to its centroid, the geometric average of all atom positions. This is particularly useful for tracking high-level motion between two groups and generating smooth analysis curves.
- Minimum: Instead of using representative points, this mode calculates the minimum pairwise distance between individual atoms in the two selected groups. This is ideal for tracing the closest contacts.
- Axis-specific Minimum: These variants allow users to calculate the minimum distances along specific axes (X, Y, or Z). It’s particularly helpful when analyzing directional motion along a specific path.
How to Visualize Distance Data
Once you’ve defined your groups and distance types, you can visualize the data in the Path Analyzer using:
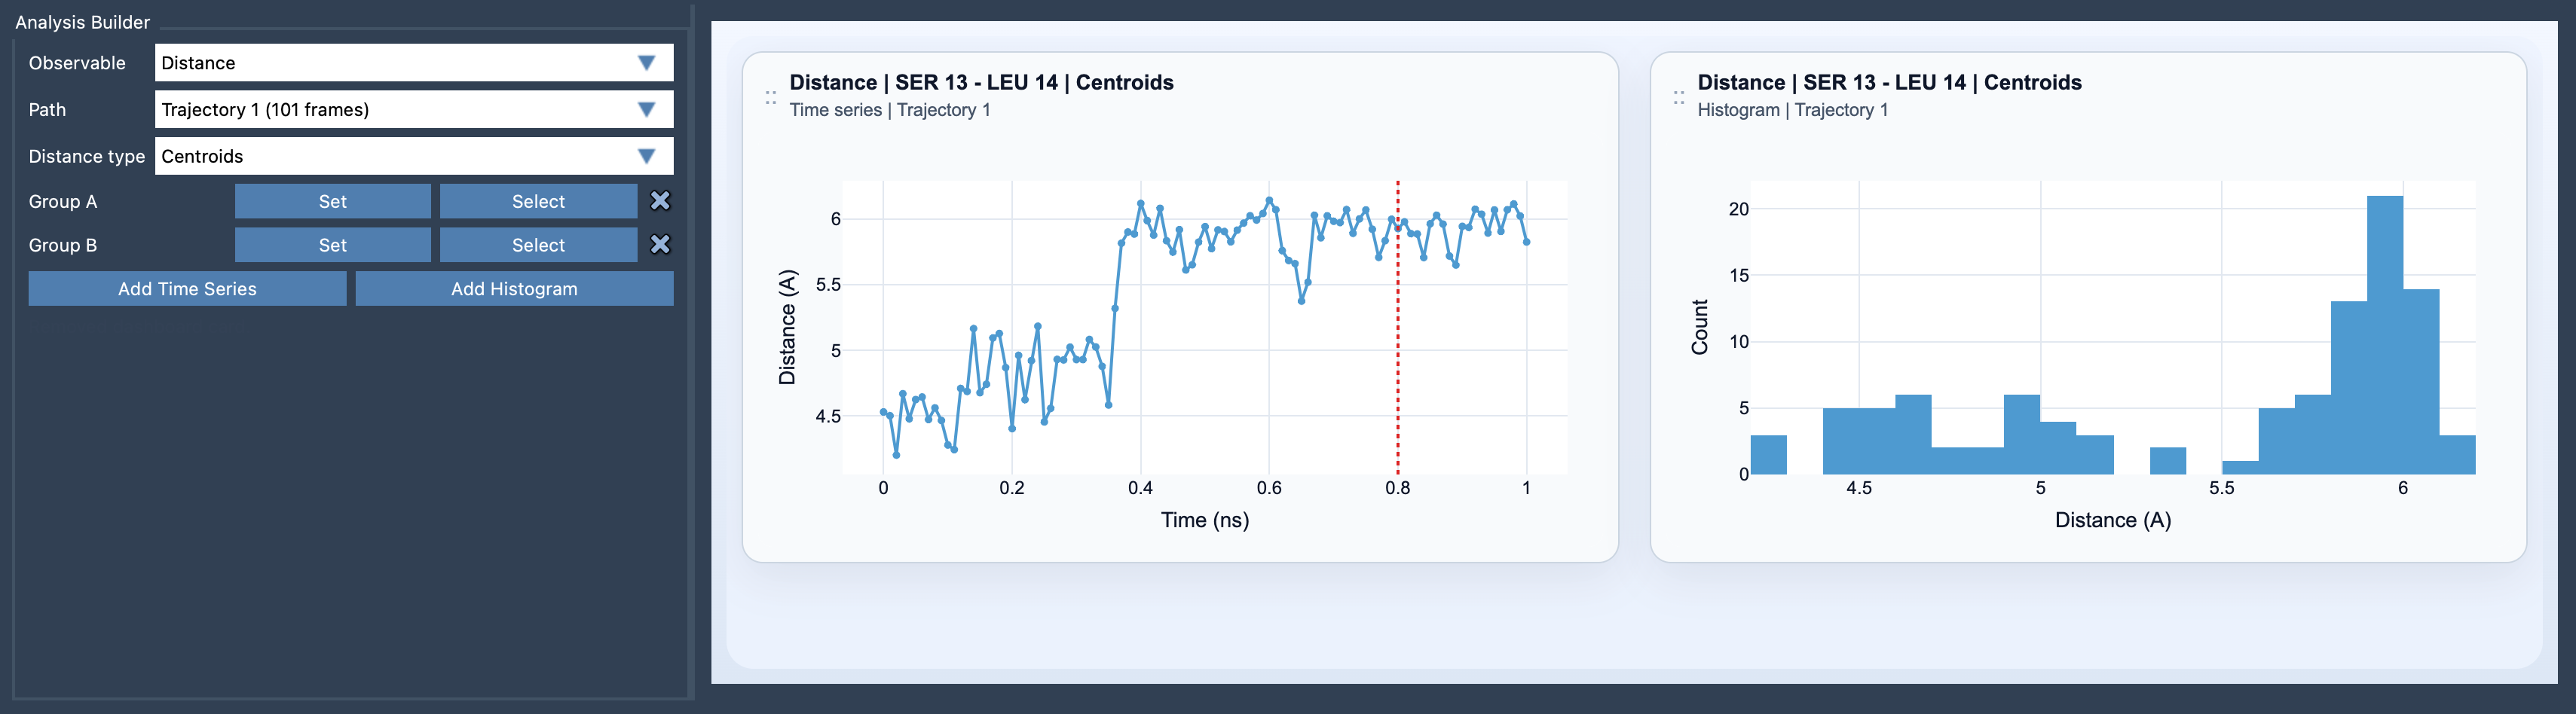
- Time Series: This mode provides a dynamic view of how distances change along the timeline, making it suitable for tracking interactions over time or during a simulation trajectory.
- Histogram: For a more static analysis, histograms let you inspect the distribution of distances, helping identify trends or dominant interactions in your data.
Here’s an example of what the Distance tool looks like in action:
Tips for Better Results
To make the most of the Distance analysis tool:
- Use smaller selections (e.g., specific atoms or residues) for chemically precise contact tracking.
- Use larger selections (e.g., domains or chains) for broader, coarse-grained signals that are easier to interpret.
- The outputs from the Distance tool can be integrated into additional analyses, such as Custom Scatter or Energy Landscape tools.
Distance analysis can transform the way you approach molecular modeling, offering a systematic look into intermolecular and intramolecular motions.
For step-by-step guidance on using distance analysis in SAMSON, visit the official documentation page here: SAMSON Documentation: Distance Analysis.
SAMSON and all SAMSON Extensions are free for non-commercial use. You can get SAMSON here.