



Explore How Proteins Evolve Over Time
Have you ever wondered how to efficiently track changes in the backbone-state of a protein as it evolves over time? As a molecular modeler, you might often need to analyze how much of a protein structure is in alpha helices, beta sheets, or left unstructured within a simulation. This high-level summary can provide tremendous insight into protein dynamics, folding patterns, or structural stability. Thankfully, SAMSON’s Secondary Structure Content analysis tool has you covered!
Understand the Secondary Structure Content Analysis
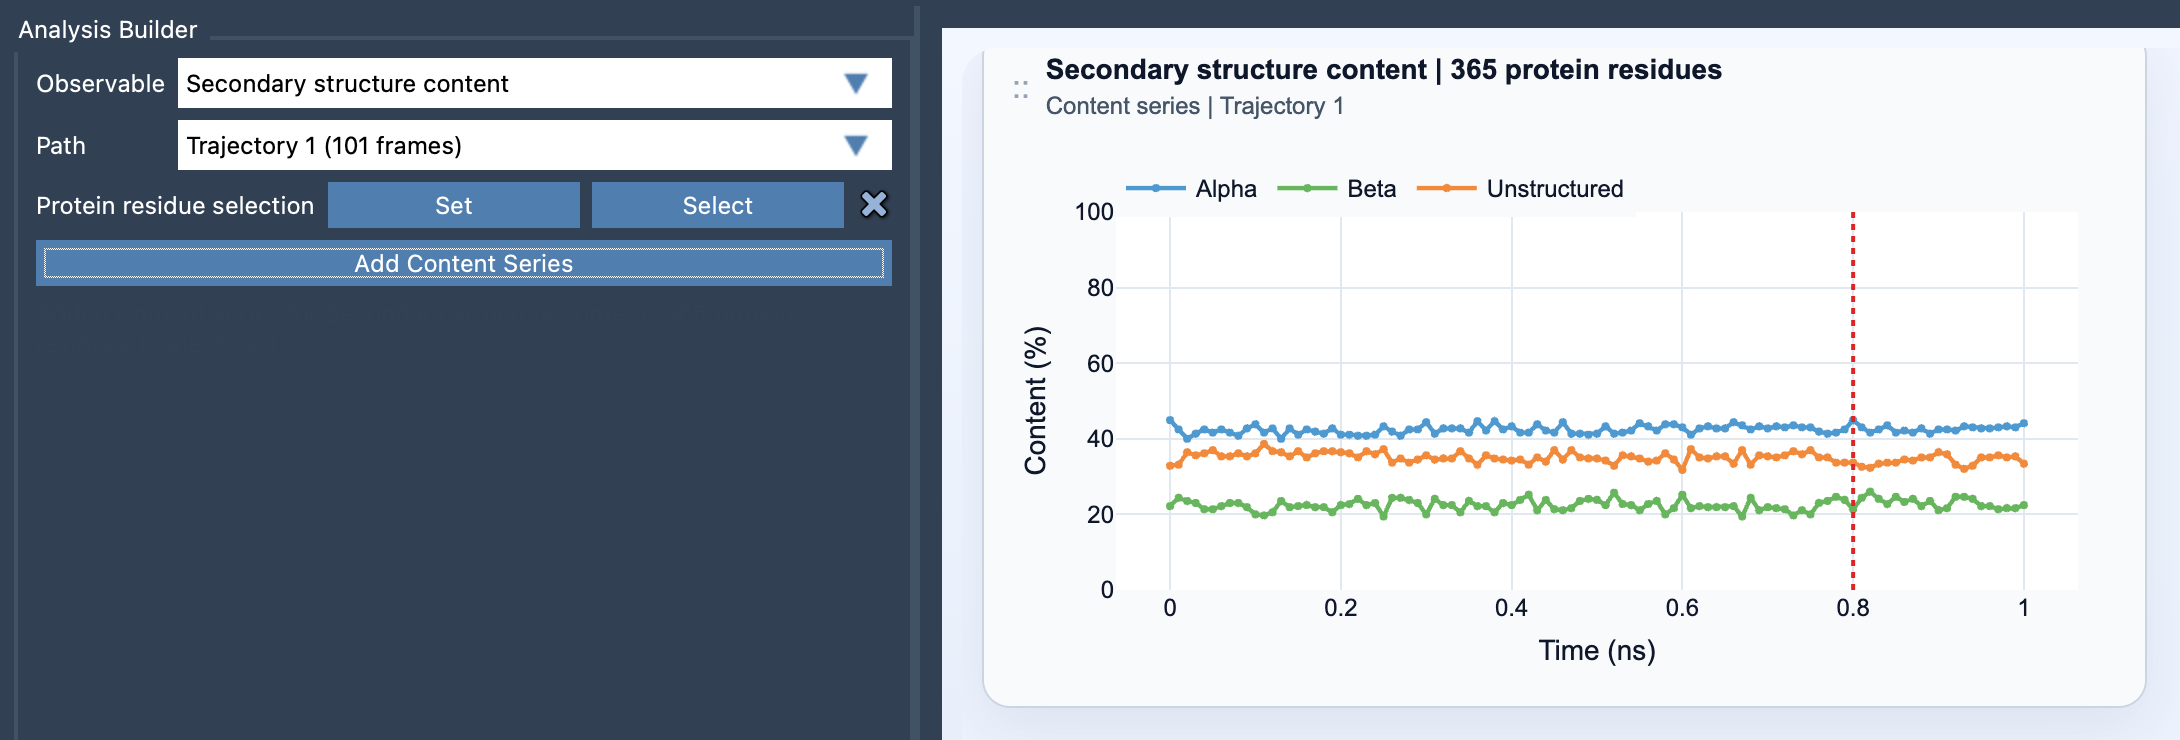
The Secondary Structure Content tool in SAMSON Path Analyzer computes the percentages of three primary structural states—alpha, beta, and unstructured—for your selected protein residues over time. This makes it an invaluable resource for quickly visualizing how protein conformation evolves in simulations.
Imagine running a folding simulation and observing transitions from alpha helices to fully beta-structured sheets. The Secondary Structure Content analysis does exactly that, but also allows you to zoom into specific regions like loops or helices, depending on your selection. This flexibility is perfect whether you’re summarizing global dynamics or focusing on crucial domains.
Your First Steps: Adding the Plot
Here’s how simple the process is:
- Open the Path Analyzer tool in SAMSON.
- Navigate to Secondary Structure Content under Observable. This tells the Path Analyzer that you’d like to analyze secondary structure.
- Select the Path you want to analyze. This could be generated from your molecular simulation.
- Define a Protein residue selection. This step lets you target what matters most—maybe a key domain or the entire protein.
- Click Add Content Series, and that’s it! The tool will automatically generate a multi-series time plot with values ranging from 0% to 100% for each structural type.
Pro Tips for Better Insights
- Choose broad selections when you want to capture protein-wide summaries. This is especially useful for quick overviews or analyzing systemic trends within large-scale simulations.
- Focus on specific residues, domains, or regions (like loop-rich areas) for localized insights. This approach is particularly helpful in understanding how certain dynamics, like binding events, impact local secondary structure.
- Combine it with Ramachandran analysis for detailed residue-level backbone dynamics alongside a broader summary. This pairing is a powerful way to extract both micro and macro details from your simulation data.
Learn More about the Tool
Want to dive into every detail of how this tool works? Check out the complete documentation at Secondary Structure Content – SAMSON documentation.
SAMSON and all SAMSON Extensions are free for non-commercial use. You can get SAMSON at SAMSON Connect.