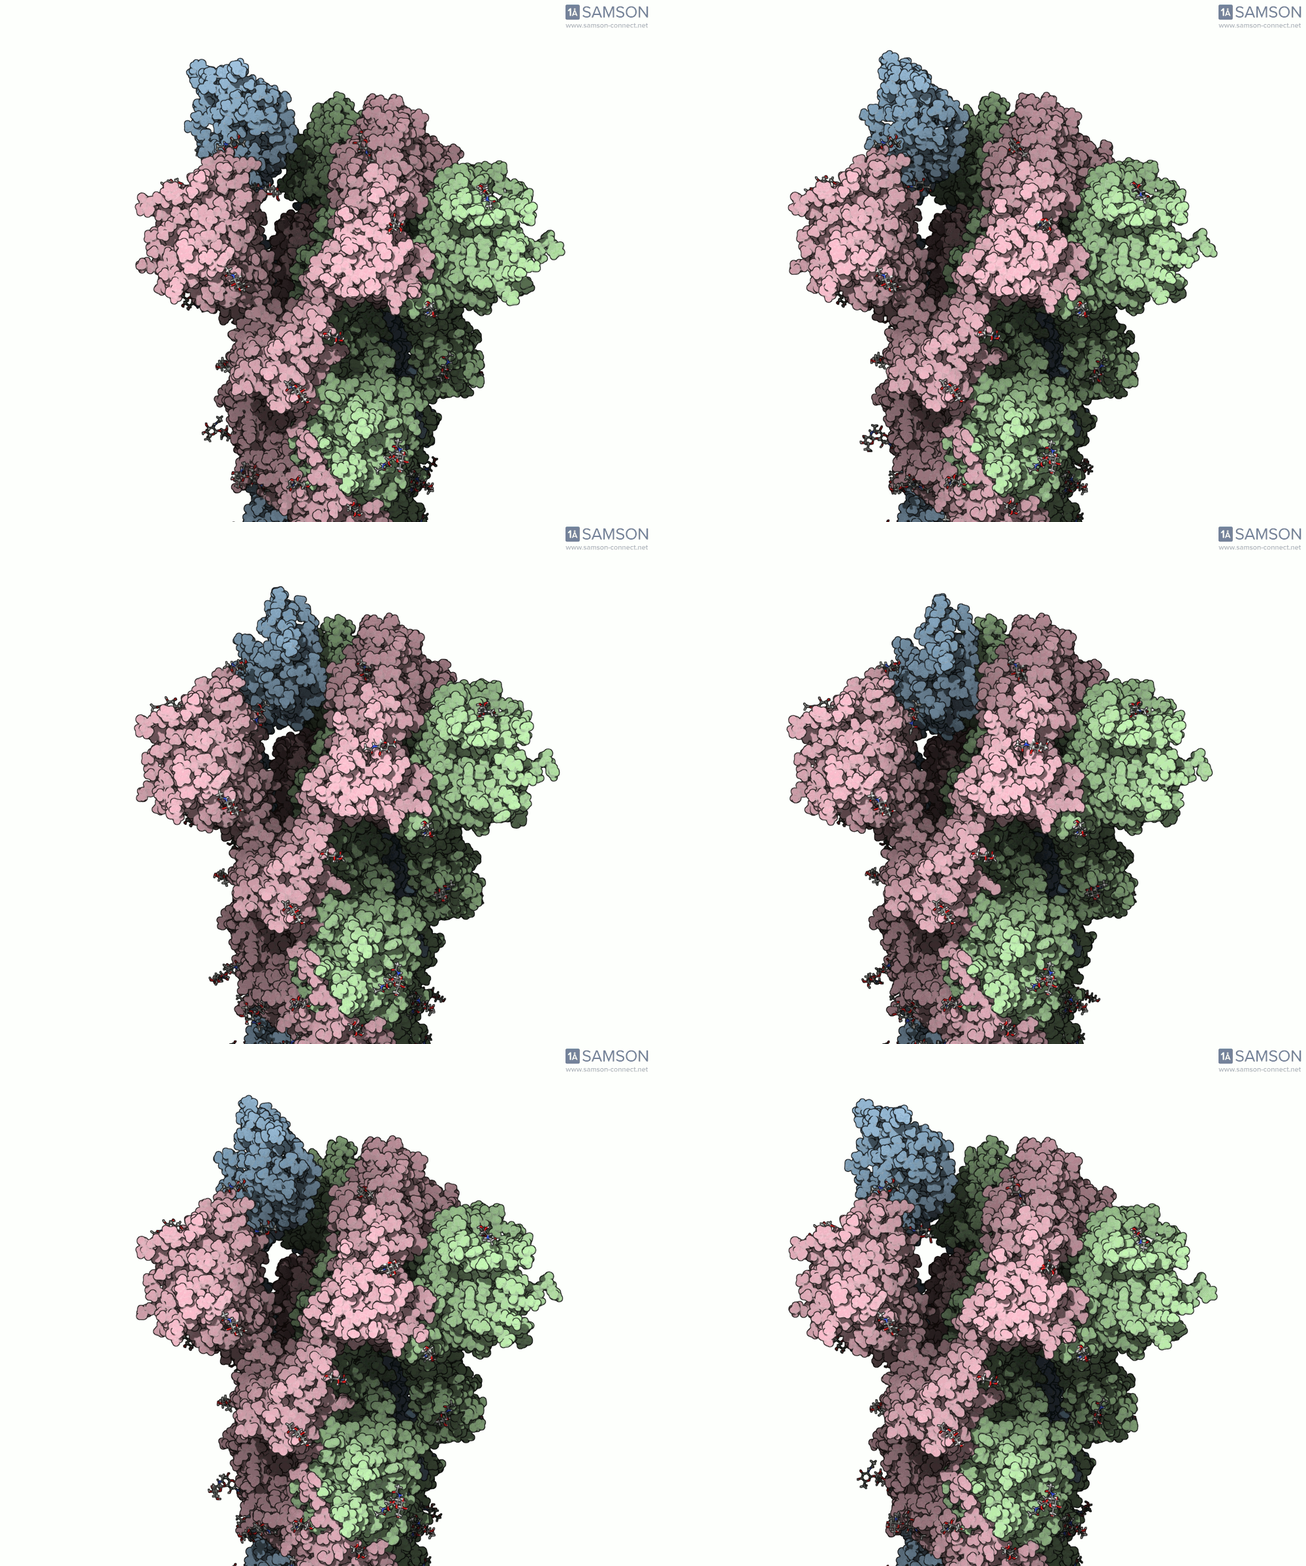
Understanding the conformational changes in viral proteins is crucial when you’re designing inhibitors, vaccines, or simply trying to comprehend viral infectivity mechanisms. One typical challenge for molecular modelers and computational biologists is visualizing these transitions effectively. Static structures in the Protein Data Bank offer snapshots, but they often don’t tell the whole story.
A clear example is the SARS-CoV-2 spike protein—the primary protein responsible for binding with human cells via the ACE2 receptor. Its function depends heavily on a key conformational change: a transition from a closed to an open state which exposes the receptor-binding domain (RBD).
To better understand this motion, the SAMSON molecular design platform offers a dynamic visualization of the spike’s opening process through computed trajectories. These animations help fill the gap between static structural data and dynamic biological reality.
From static PDB files to dynamic trajectory
The researchers behind this work started with two known conformational states of the spike protein: the closed state (PDB: 6VXX) and the open state (PDB: 6VYB). While both structures provide critical insights, they differ in residue numbers, posing some difficulty in aligning them for interpolation purposes.
To generate a realistic trajectory between these two forms, the scientists used two specific SAMSON modules:
- ARAP Interpolation Path module, which quickly creates a rough transition path while maintaining structural rigidity.
- P-NEB (Parallel Nudged Elastic Band) module, which refines the generated path to better reflect likely energetic pathways.
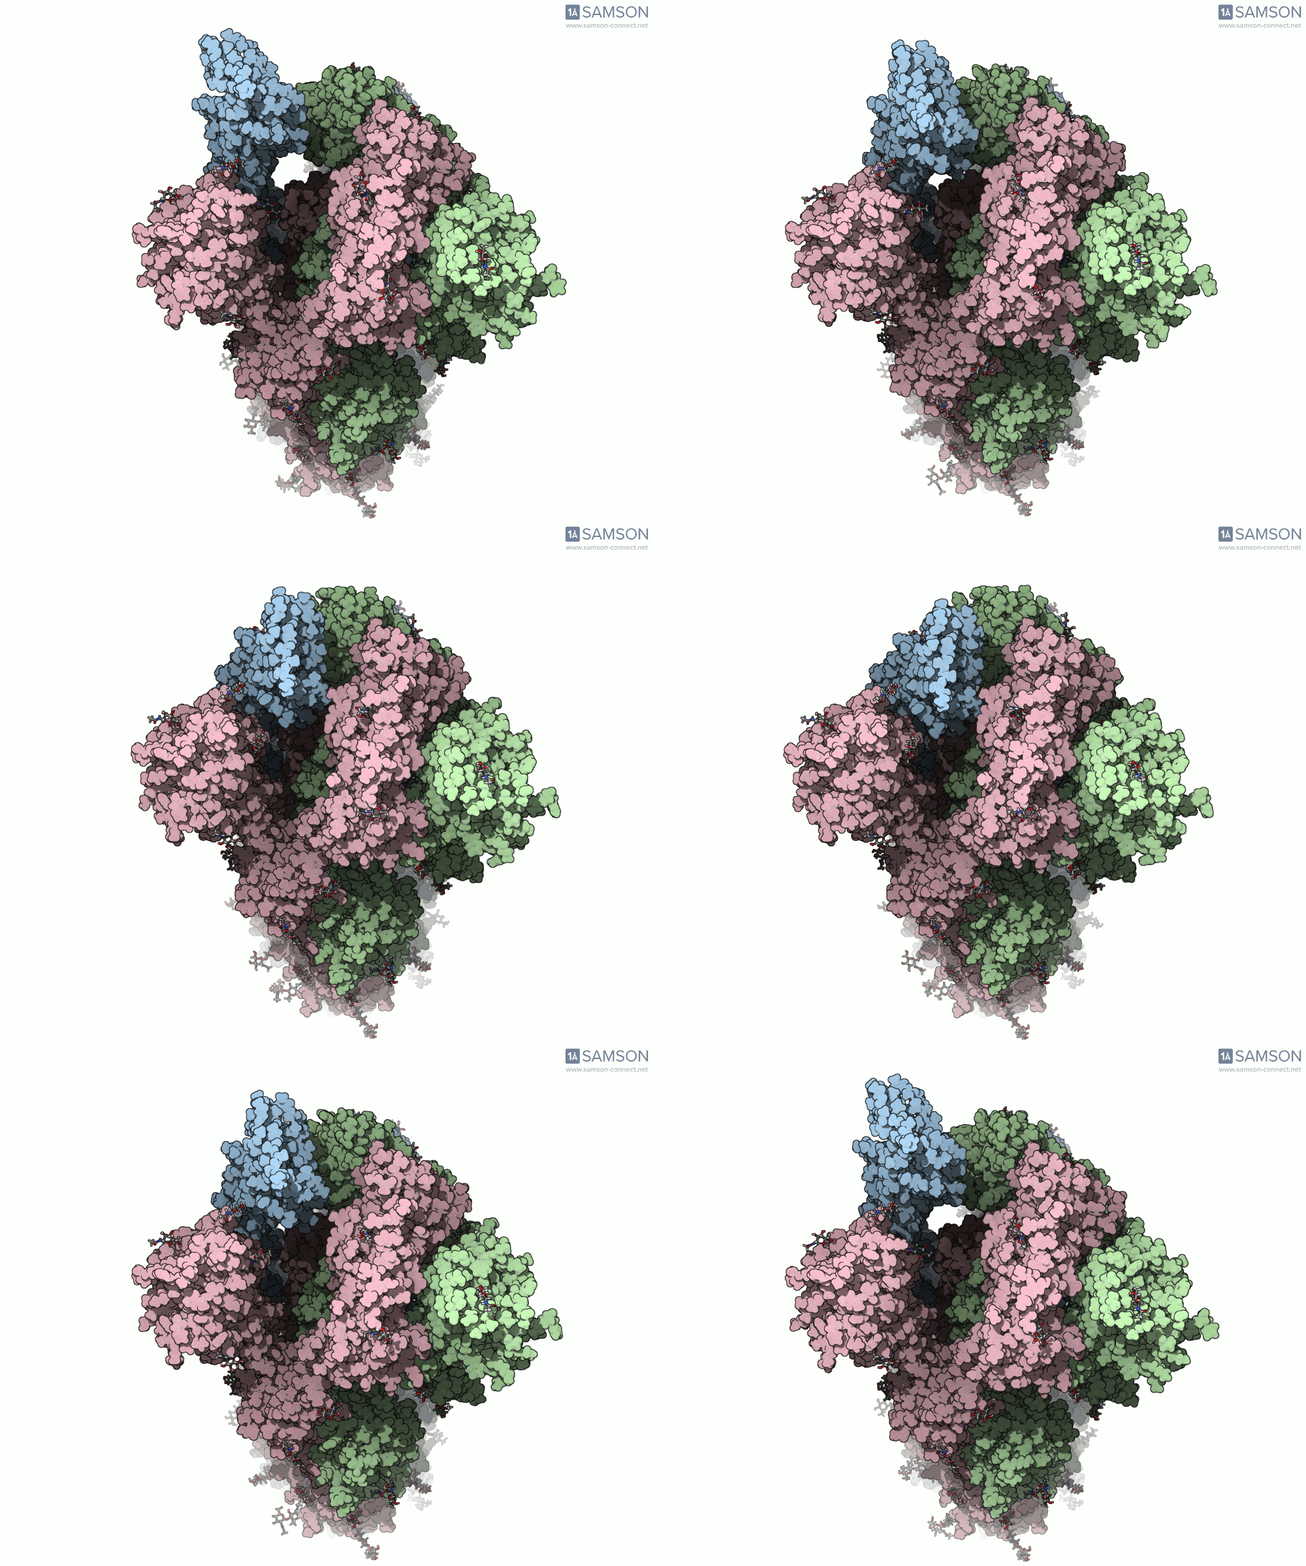
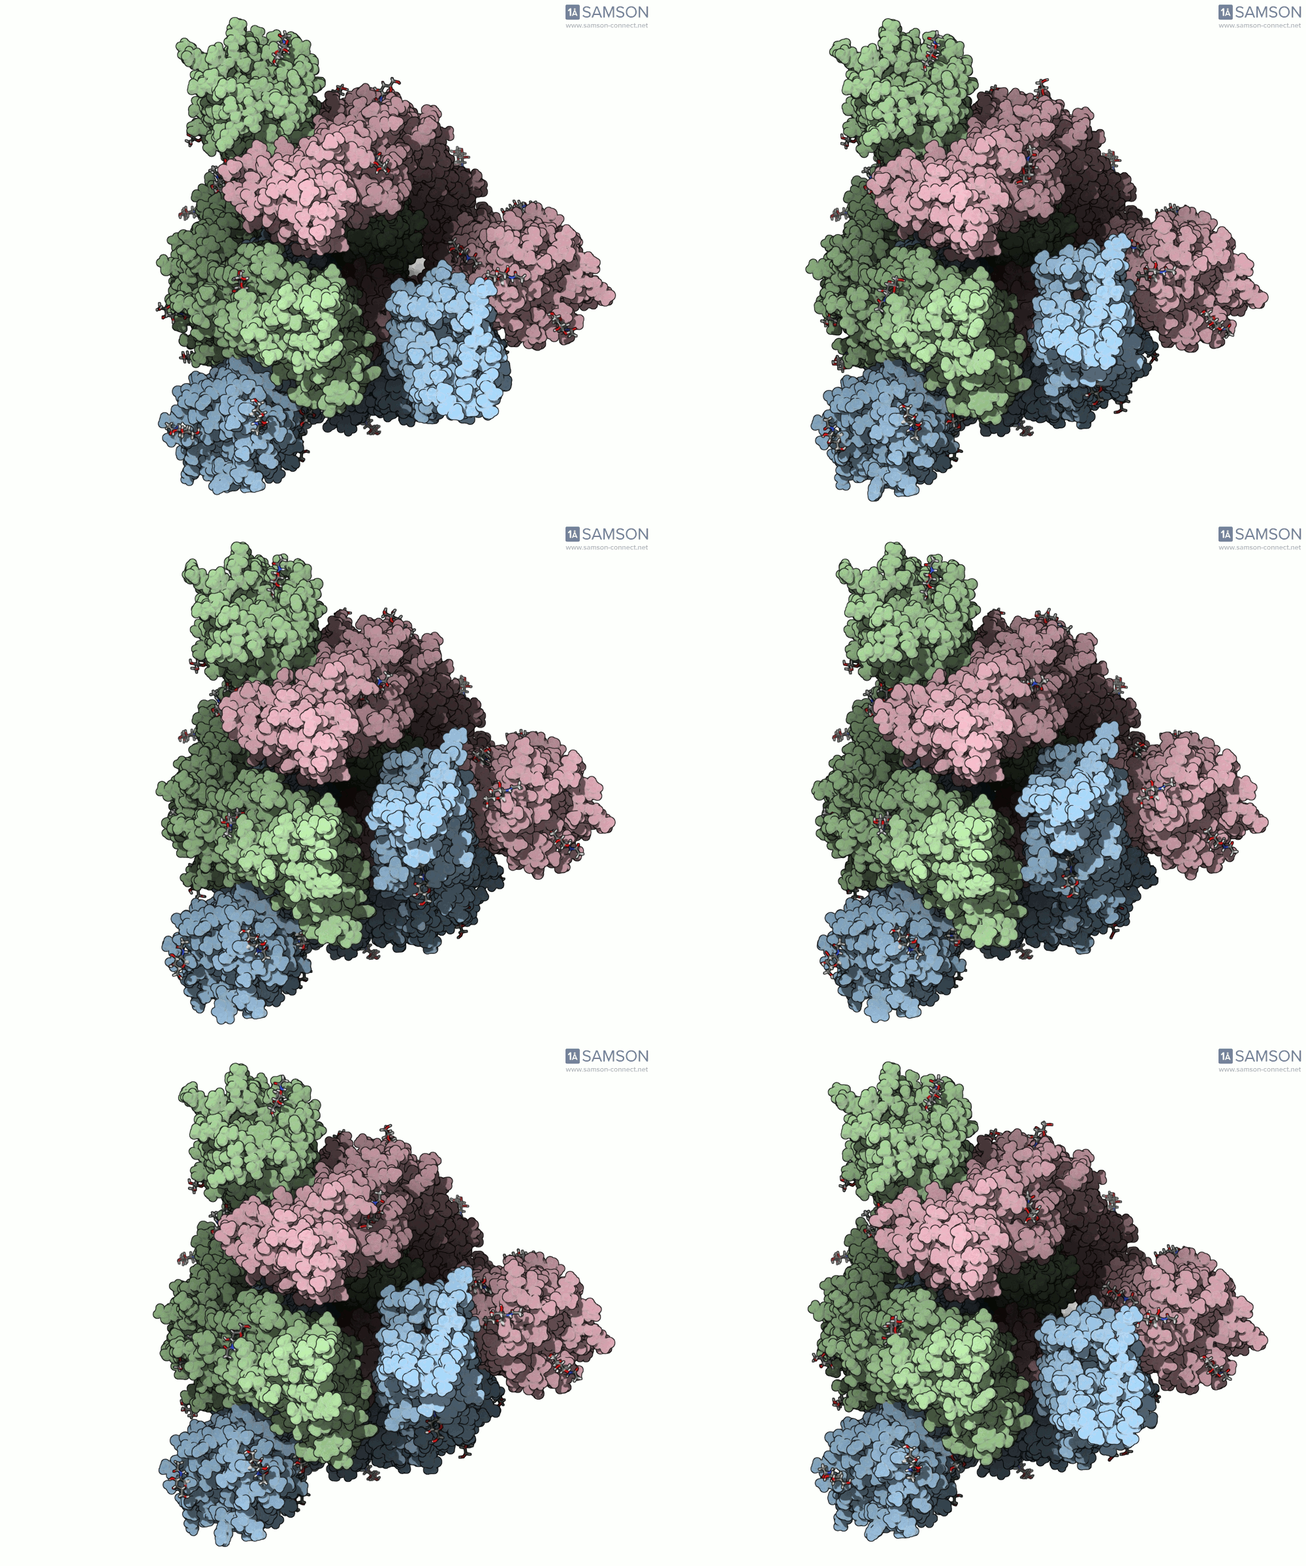
Below, you can watch the spike morph from its closed form (“down” state) to its open, binding-ready form (“up” state). These aren’t artistic visualizations—they’re trajectory files computed using molecular data.
Side view

Angled view

Top view

These files can be downloaded in multiple formats (.pdb, as a trajectory or single file, or in SAMSON’s native .sam format) and are useful not only to visualize the spike’s behavior but also as starting points for further energetic analyses, docking simulations, or machine learning models.
Keep in mind, these trajectories are illustrative and have not yet been experimentally verified. However, as many researchers know, even non-verified interpolated motions can offer valuable guidance during early-stage hypothesis generation and exploratory modeling.
Why this matters
If you’ve ever tried to simulate such a conformational switch manually, you know how tedious and time-consuming it can be. The combination of SAMSON’s ARAP and P-NEB modules offers a way to quickly visualize realistic transition paths without sacrificing too much on accuracy. And because this method is integrated inside a comprehensive platform, it simplifies workflows significantly.
To learn more and access the full tutorial, visit this page.
SAMSON and all SAMSON Extensions are free for non-commercial use. You can download the platform at https://www.samson-connect.net.


