



Watching a molecule move through a simulation can quickly become hard to interpret. Individual atoms trace complicated routes, and a large structure may contain far more motion than you need to focus on. If your question is simply “where did this ligand—or this group of atoms—go?”, a center-of-mass pathline can make the movement easier to read.
In SAMSON, the Pathlines visual model displays the center-of-mass (COM) trajectory of selected atoms along one or more paths. It offers a compact way to inspect a ligand’s route, compare movement across paths, or follow a protein region without drawing attention to every atom’s individual trajectory. A pathline is a visual aid for understanding motion; it does not, by itself, explain why the motion occurred.
Choose what you want to follow
The result depends on two selections: the atoms whose COM you want to track, and the path or paths you want to inspect. In the Document view, select the atom group and path nodes. To add more than one node to the selection, hold Ctrl on Windows or Cmd on macOS.
These defaults are useful to know before creating the visualization: if no atoms are selected, SAMSON uses the entire system; if no paths are selected, it uses all paths in the document. Selecting deliberately helps avoid an unexpectedly broad visualization—and makes it easier to understand exactly which group the line represents.
The tutorial’s sample system provides a practical example: lactose permease (1PV7), its ligand thiodigalactosid (TDG), and two unbinding paths. In the Document view, the protein is named Protein_chain_A and the ligand TDG. Selecting the ligand and a path lets you focus on the ligand’s COM motion rather than the movement of the whole protein.

Create the pathline
- Open Visualization > Visual model > More…. The shortcut is Ctrl/Cmd + Shift + V.
- Choose Pathline of the center of mass in the dialog, then click OK.
SAMSON adds a visual pathline for the COM of the selected atoms along the selected path or paths. The display can help you compare a route’s overall direction and extent at a glance, while keeping the structural context visible.
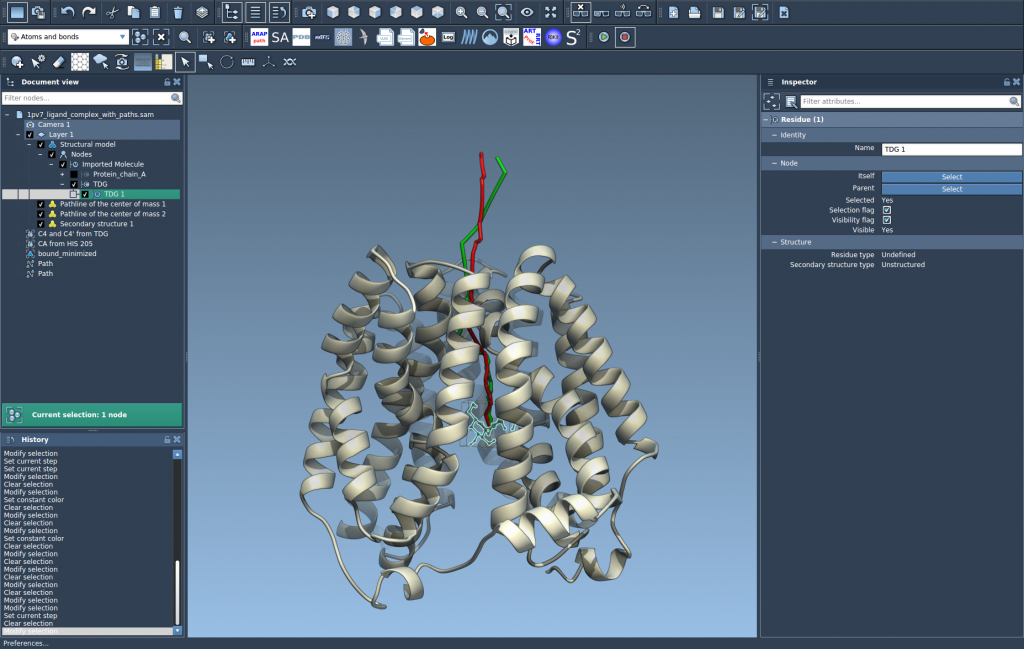
Make the view answer your question
Use the path controls to explore the movement: double-click a path in the Document view to start or stop it, or right-click the path to find its Path > … options. To access path controllers, select the path and open the Inspector with Ctrl/Cmd + 2.
You can also select the pathline visual model and adjust its color and thickness in the Inspector. These small presentation choices matter when a path overlaps the structure or when you are comparing several visual elements. Keep the display clear enough that the path can be distinguished without obscuring the atoms you are studying.
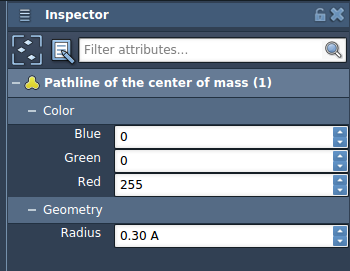
One maintenance detail is worth remembering: deleting a path also removes its associated pathline. Deleting atoms used for a pathline changes the visualization. If a display no longer looks as expected, check whether its path or selected atoms have changed.
Pathlines are especially useful when the main challenge is seeing collective movement without getting lost in atom-by-atom detail. They can help you inspect ligand unbinding or rebinding routes, domain movement, and COM motion along reaction-coordinate paths. For a complementary workflow, SAMSON’s related tutorials cover computing ligand or protein paths and exporting atom trajectories along paths.
For the complete walkthrough and sample-system details, read the Pathlines tutorial.
Note: SAMSON and all SAMSON Extensions are free for non-commercial use. Get SAMSON.