



A molecular group can change its overall shape without becoming noticeably larger or smaller. That makes radius of gyration useful but sometimes insufficient: a single size measure may not reveal whether the group is becoming less spherical. Asphericity helps address this specific blind spot by reporting how far a selected group deviates from a spherical shape along a path or trajectory.
This distinction matters when you are comparing structures or following a modeled change. Two conformations may have similar overall size yet differ in how their shape is distributed. Rather than treating one measurement as a complete description, use asphericity as a complementary shape descriptor. It gives you another way to notice changes that a size-focused view could make easy to overlook.
Turn a path into a shape question
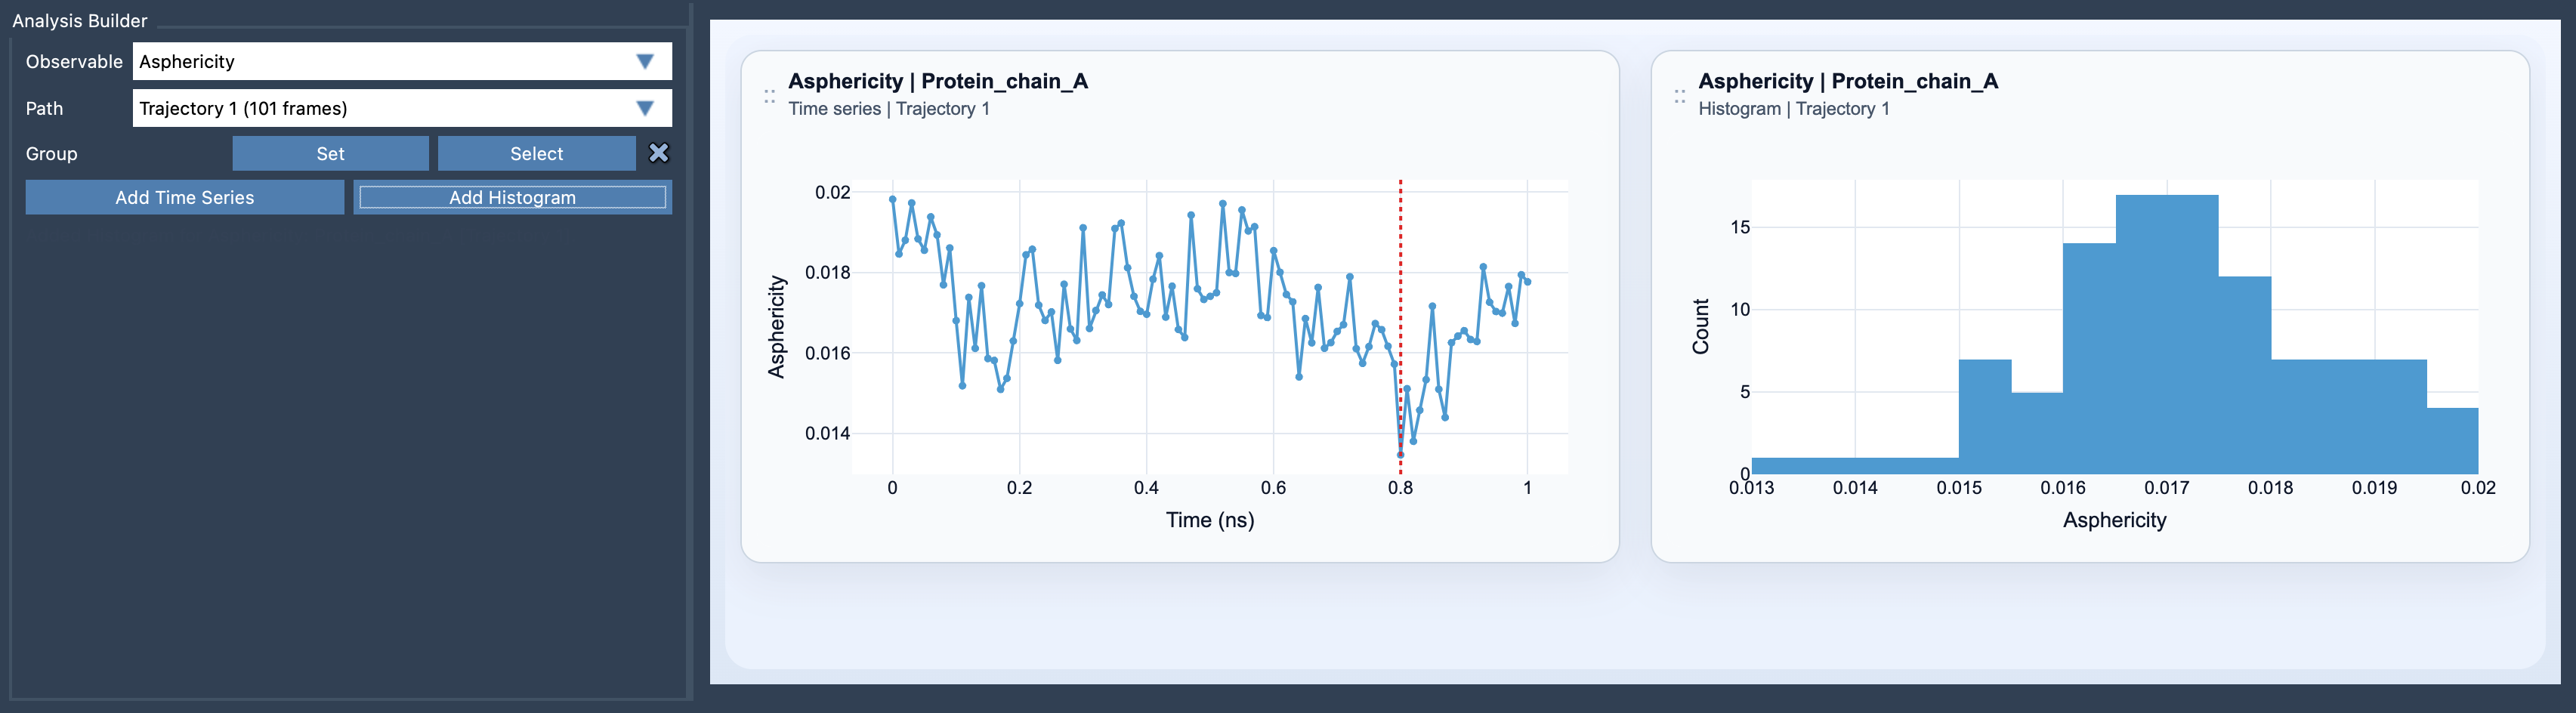
In SAMSON’s Path Analyzer, you can inspect asphericity as either a time series or a histogram. To create a plot:
- Open Path Analyzer.
- Select Asphericity as the observable.
- Choose the path you want to analyze.
- Define the atom-containing group whose shape you want to follow.
- Add a time series or a histogram.
The group selection is important: the result describes the selected group, not automatically the entire molecular system. Before interpreting a plot, make sure the selected atoms match the question you are asking. For example, if you want to follow a particular region, define that region as the group rather than assuming a whole-system measurement will isolate its behavior.
Choose the view that fits your question
A time series keeps the values in path order. Use it when you want to see how the shape descriptor varies as you move along the path, and to identify portions where the measured shape changes. A histogram instead summarizes the range of sampled values. It is useful for seeing which values occur across the path, but it does not preserve where along the path they occurred. If the sequence of changes matters, start with the time series; if you want an overview of the sampled range, inspect the histogram.
Neither view is a verdict on whether a structure is “good” or “bad.” Asphericity answers a narrower question: how far the selected group deviates from a spherical shape. Interpret it in the context of the model and the path you are studying. A change in the plot is a reason to examine the corresponding structures and ask what is changing—not, by itself, an explanation of why it changed.
Build a more useful shape picture
For a fuller view, compare asphericity with radius of gyration and the shape parameter. These observables provide complementary ways to describe global shape changes. Together, they can help you distinguish a question about overall size from a question about shape anisotropy, while avoiding the temptation to make one scalar carry the whole interpretation.
A practical habit is to state the group and the path whenever you share a plot. That small bit of context makes it clearer what the measurement represents and helps others interpret the result. When a size measure seems too coarse to describe what you see, asphericity offers a focused next check.
Learn more about Asphericity in the SAMSON documentation.
Note: SAMSON and all SAMSON Extensions are free for non-commercial use. Get SAMSON.