



A molecular trajectory can produce many useful measurements: distances, energies, RMSD, radius of gyration, solvent-accessible surface area, and more. But reading each measurement separately can make it difficult to see how they relate. Does a distance increase as energy changes? Do structural deviations appear alongside changes in compactness? A custom scatter plot helps bring two saved scalar analyses into the same view.
Turn two measurements into one question
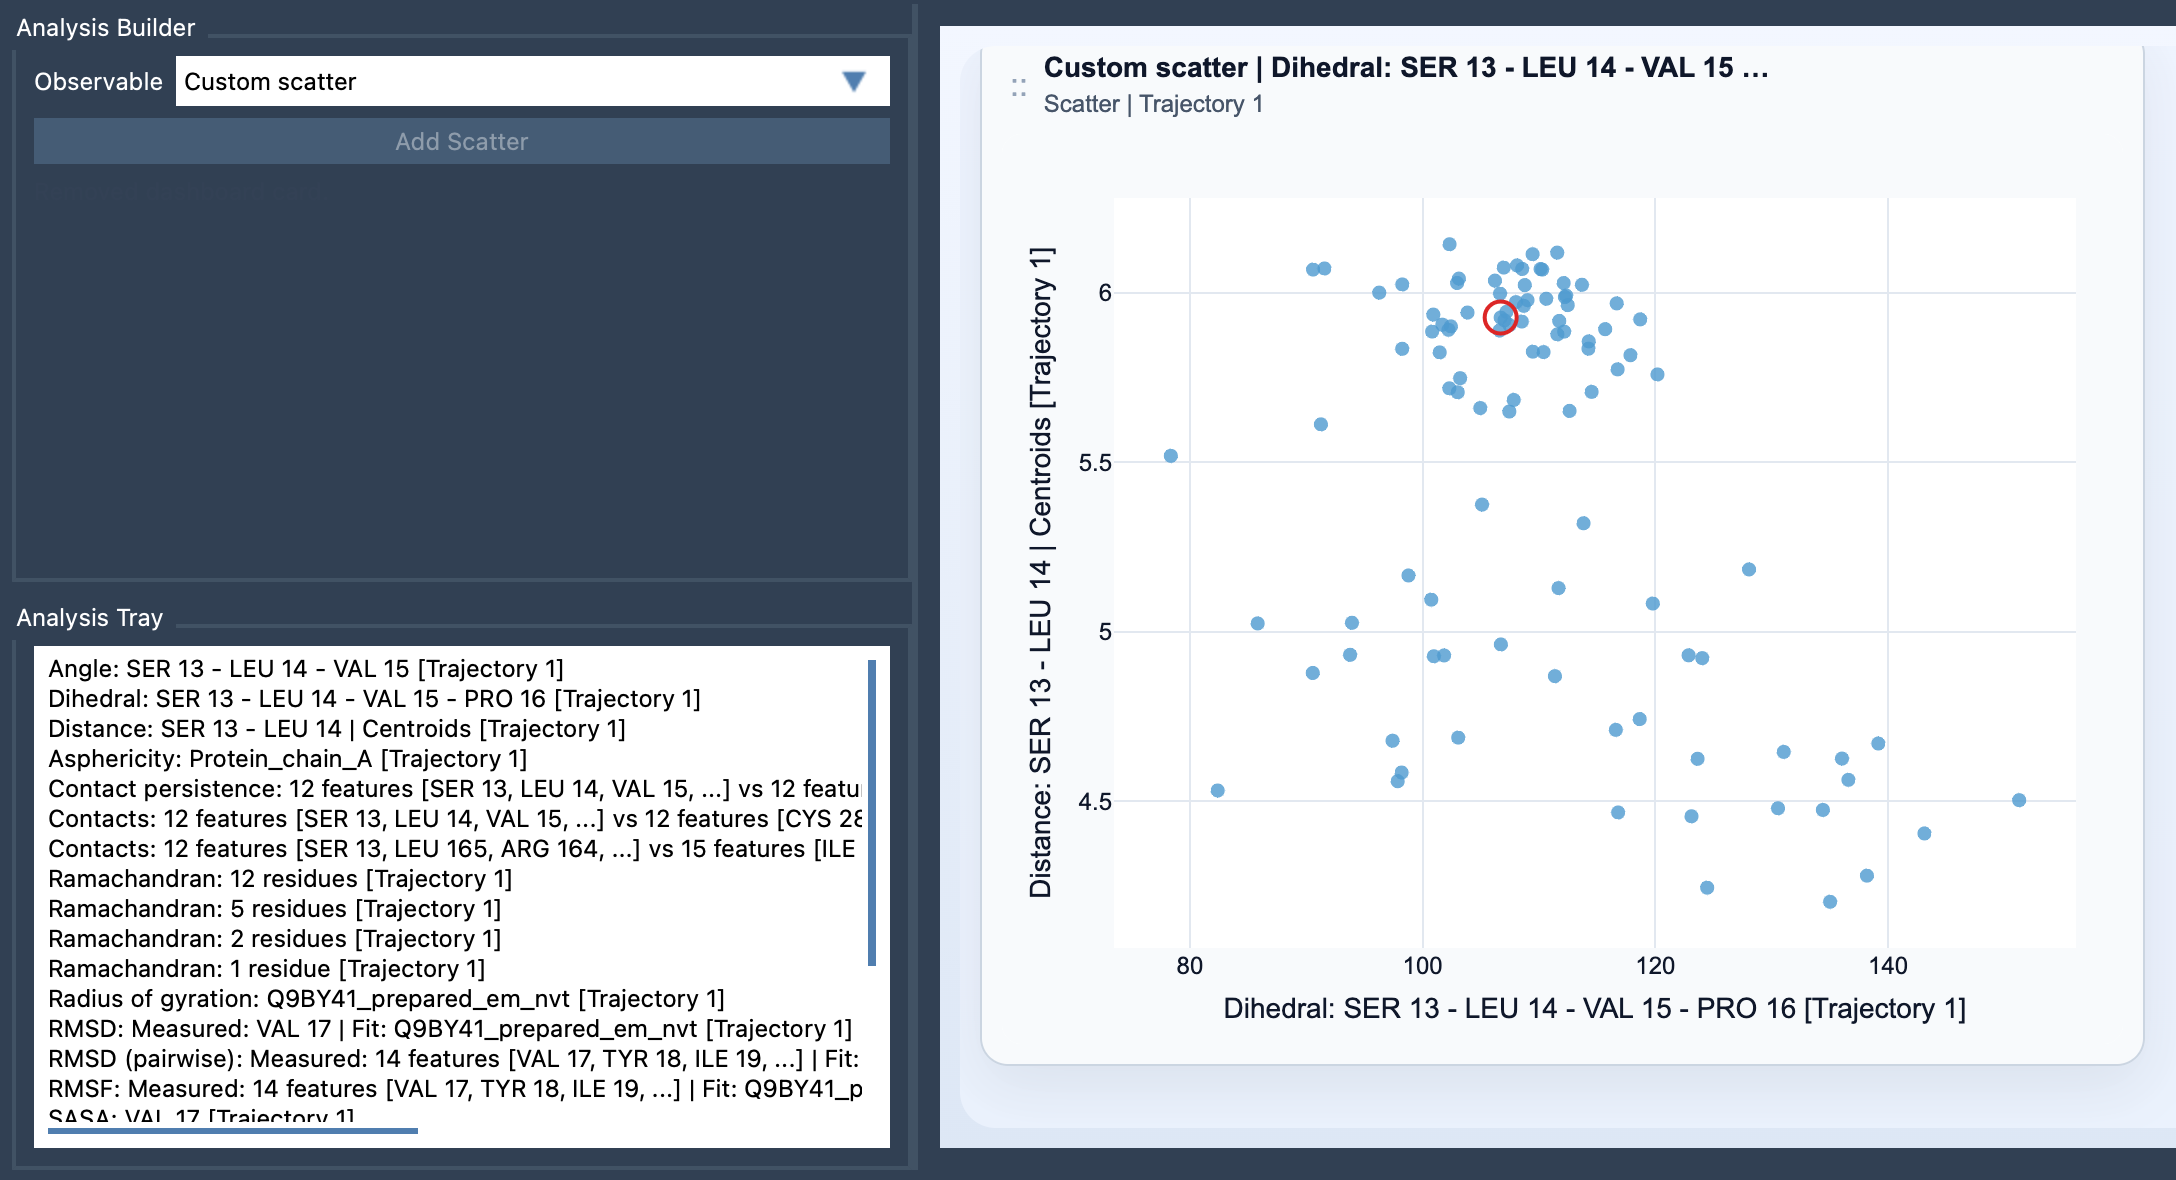
In SAMSON’s Path Analyzer, Custom scatter is a derived analysis: instead of selecting atoms directly for the plot, you use two scalar analyses already saved in the Analysis Tray. Each point represents a sampled pair of values, one from each analysis. That makes the plot a practical way to ask a focused question about your data.
For example, you might compare Distance vs Energy to see whether changes in a chosen distance tend to accompany changes in energy. Or compare RMSD vs Radius of gyration to look at structural deviation alongside molecular size. SASA vs Distance can help you examine solvent exposure in relation to a distance measurement. These are examples of useful comparisons, not conclusions the plot makes for you.
Build the plot without losing track of the inputs
- Open Path Analyzer.
- Create or reuse two saved scalar analyses in the Analysis Tray.
- Choose Custom scatter under Observable.
- Select exactly two scalar analyses in the tray, then click Add Scatter.
The two-input requirement is useful to keep in mind when preparing the plot. If the option is not behaving as expected, first check that both tray entries are scalar analyses and that exactly two are selected. The plot uses the saved analyses, so decide what question each one represents before comparing them.
Read the shape, then return to the science
A scatter plot can make broad patterns easier to notice. Points that follow a rising or falling trend suggest that the two measurements vary together or in opposite directions across the sampled data. Separate groups may prompt you to investigate whether the samples differ in a meaningful way. A less organized cloud may indicate that a simple relationship is not obvious in this view.
These patterns are a starting point for interpretation, not proof of cause and effect. A visible association does not by itself explain why measurements change together. Consider the molecular context, how each scalar analysis was defined, and whether the sampled values are appropriate to compare. In particular, make sure the pair answers a scientific question you actually care about rather than choosing measurements only because they are available.
Use frame linking to connect a point to the path
When both source analyses come from the same path and remain frame-linked, the scatter plot can stay connected to the current frame. In that case, clicking a point can move the path to its corresponding frame. This gives you a way to investigate a point of interest in the context of the molecular structure, rather than treating the plot as an isolated picture. Frame-linked interaction depends on the source analyses being frame-linked, so it may not apply to every pair.
From overview to deeper exploration
Custom scatter is often a helpful first look at two observables. Once you have spotted a pattern worth investigating, the same comparison can guide a more detailed view, such as a 2D density map or an Energy landscape. Start with the scatter plot to see how the two measurements are distributed; then choose a follow-up analysis based on what you want to understand.
For the complete instructions, see the Custom Scatter documentation.
Note: SAMSON and all SAMSON Extensions are free for non-commercial use. Get SAMSON.