



A molecular trajectory can produce a lot of numbers: distances, energies, RMSD, radius of gyration, solvent-accessible surface area, and more. Looking at each measurement separately may show that it changes, but not whether two changes happen together. Does a particular distance tend to increase as energy changes? Do large RMSD values appear alongside a more expanded structure? A custom scatter plot puts two saved scalar analyses into one view so you can start investigating those relationships.
This is useful when the pain point is not generating another measurement, but making sense of how measurements relate. Instead of scanning two separate plots and trying to match their values by eye, each point in the scatter represents a pair of scalar values. A pattern may suggest a relationship worth investigating; separate groupings may prompt you to ask whether the trajectory visits distinct regions of the observable space.
Build a plot around a question
Start with a specific scientific question, rather than choosing two measurements simply because they are available. For example, you might ask whether distance and energy vary together, whether RMSD changes alongside radius of gyration, or whether SASA relates to a distance of interest. These are examples of useful pairs—not conclusions about what your system will do. The plot helps you inspect the data; interpretation still depends on the molecular system and the analyses you created.
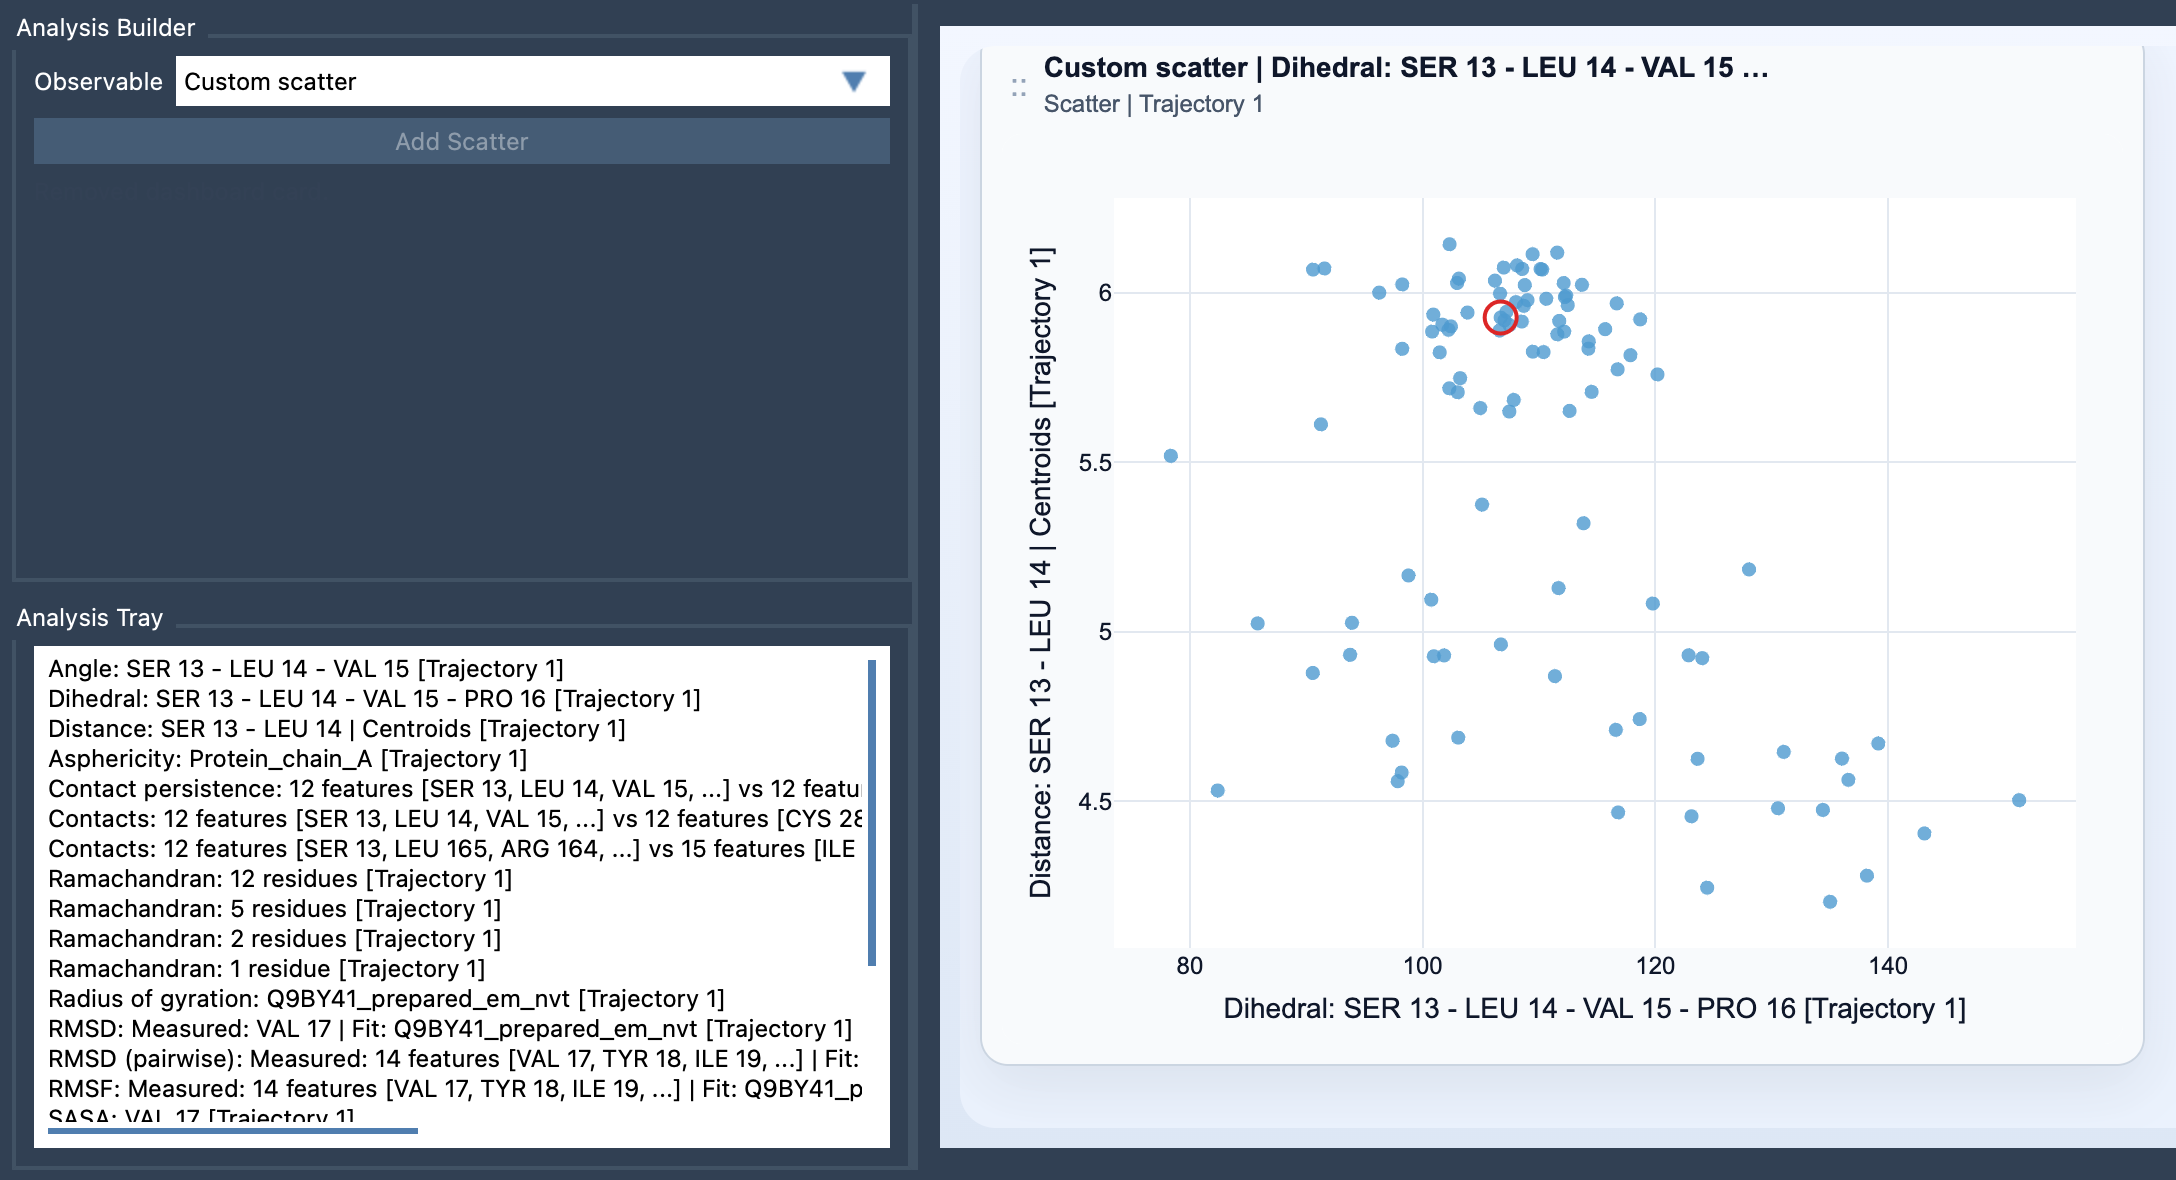
In SAMSON’s Path Analyzer, create or reuse two saved scalar analyses in the Analysis Tray. Choose Custom scatter under Observable, select exactly two saved scalar analyses, and click Add Scatter. The source analyses must be scalar analyses. Unlike an analysis that starts from direct atom selections, this is a derived analysis: it uses the saved results in the Analysis Tray.
Read the shape before drawing conclusions
Each plotted point is one sampled pair of scalar values. Look first for the overall arrangement: do points appear to follow a general direction, gather into groups, or occupy separate regions? These patterns can help you spot possible correlations, anticorrelations, or clusters and decide what to inspect next. A visual association is a clue, not proof that one observable causes the other. Consider the trajectory and the scientific context before assigning meaning to a pattern.
It also helps to keep the question narrow. If the scatter is hard to interpret, check that the two measurements are the pair you intended to compare and that each addresses the same scientific question. A plot is most useful when you can explain what a point represents and why the two observables belong together.
Connect a point back to the path
When both source analyses come from the same path and remain frame-linked, the scatter can stay connected to the current frame. In that case, clicking a point can move the path to its corresponding frame. This gives you a way to follow up on an interesting region of the plot by returning to the associated structure, rather than treating the scatter as an isolated graphic. Frame-linked behavior depends on those source analyses being linked as described; do not assume it will apply to every pair of analyses.
Use the scatter as a first step
A custom scatter is often a practical starting point for exploring two observables. If the relationship merits a more spatially focused view, the documentation also points to 2D density maps and Energy landscapes as possible next analyses. Begin with the pair that best expresses your question, inspect the distribution, and then decide whether another view would help clarify what you see.
For the exact setup steps and input requirements, see the Custom Scatter documentation.
Note: SAMSON and all SAMSON Extensions are free for non-commercial use. Get SAMSON.