



When constructing or refining protein structures, molecular modelers can often encounter a critical question: are my backbone conformations valid? Misplaced or strained residues can lead to inaccurate simulations or misrepresent biological functions. This is where the Interactive Ramachandran Plot in SAMSON becomes an indispensable tool.
The Challenge: Validating Protein Backbone Conformations
Protein backbone conformations, defined by φ (phi) and ψ (psi) dihedral angles for each residue, must fall within energetically allowed regions. If they don’t, molecular models can exhibit unrealistic, strained structures that may fail during energy minimization or simulation. The standard Ramachandran plot is a proven way to visualize these angles, showing preferred regions based on steric and energetic constraints.
However, most tools only offer static plots, requiring numerous steps to cross-check individual residues, fix issues, and iterate back to the model. This fragmented process can be time-consuming and prone to errors. The Interactive Ramachandran Plot for SAMSON tackles this pain point effectively.
Interactive Ramachandran Plot: A Live Solution
The SAMSON extension goes beyond visualizing φ and ψ angles. It allows you to interactively explore and edit protein backbone conformations directly from the Ramachandran plot. Here’s how it works:
Insights at a Glance
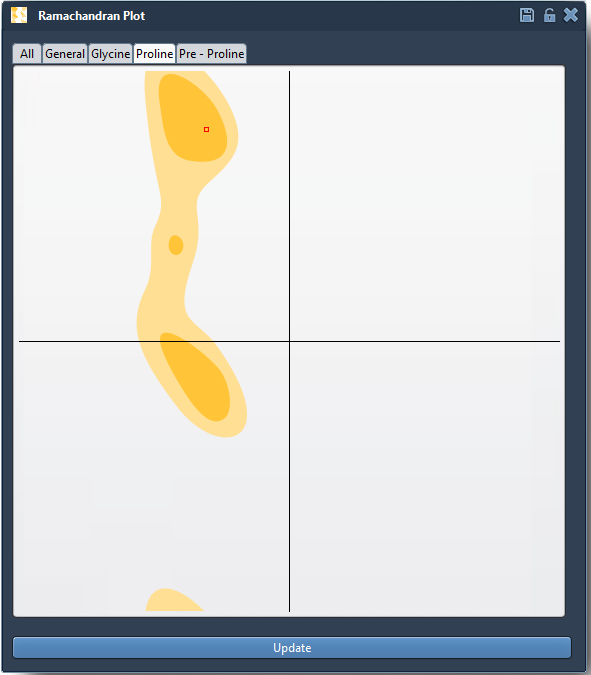
The plot is color-coded for intuitive interpretation:
- Yellow areas: Energetically favorable regions.
- White areas: Sterically or energetically disallowed conformations.
Residues are plotted as points, grouped into categories like General, Glycine, Proline, and Pre-Proline. For example, selecting a residue (e.g., a Proline) highlights it in the 3D viewport and displays its φ and ψ angles in the status bar for precise tracking:
Editing Residues, Seamlessly
One standout feature of the extension is the ability to interactively adjust angles:
1. Drag Residues on the Plot
- Click and drag points in the plot to instantly change dihedral angles.
- You can observe updates occurring live in the 3D model, providing immediate feedback.
- Make adjustments easily, and use Ctrl/Cmd + Z to undo changes instantly if necessary.
2. Use the Twister Editor
For more comprehensive conformational adjustments, the Twister Editor integrates seamlessly within SAMSON:
- Select the Twister Editor from the left-hand menu.
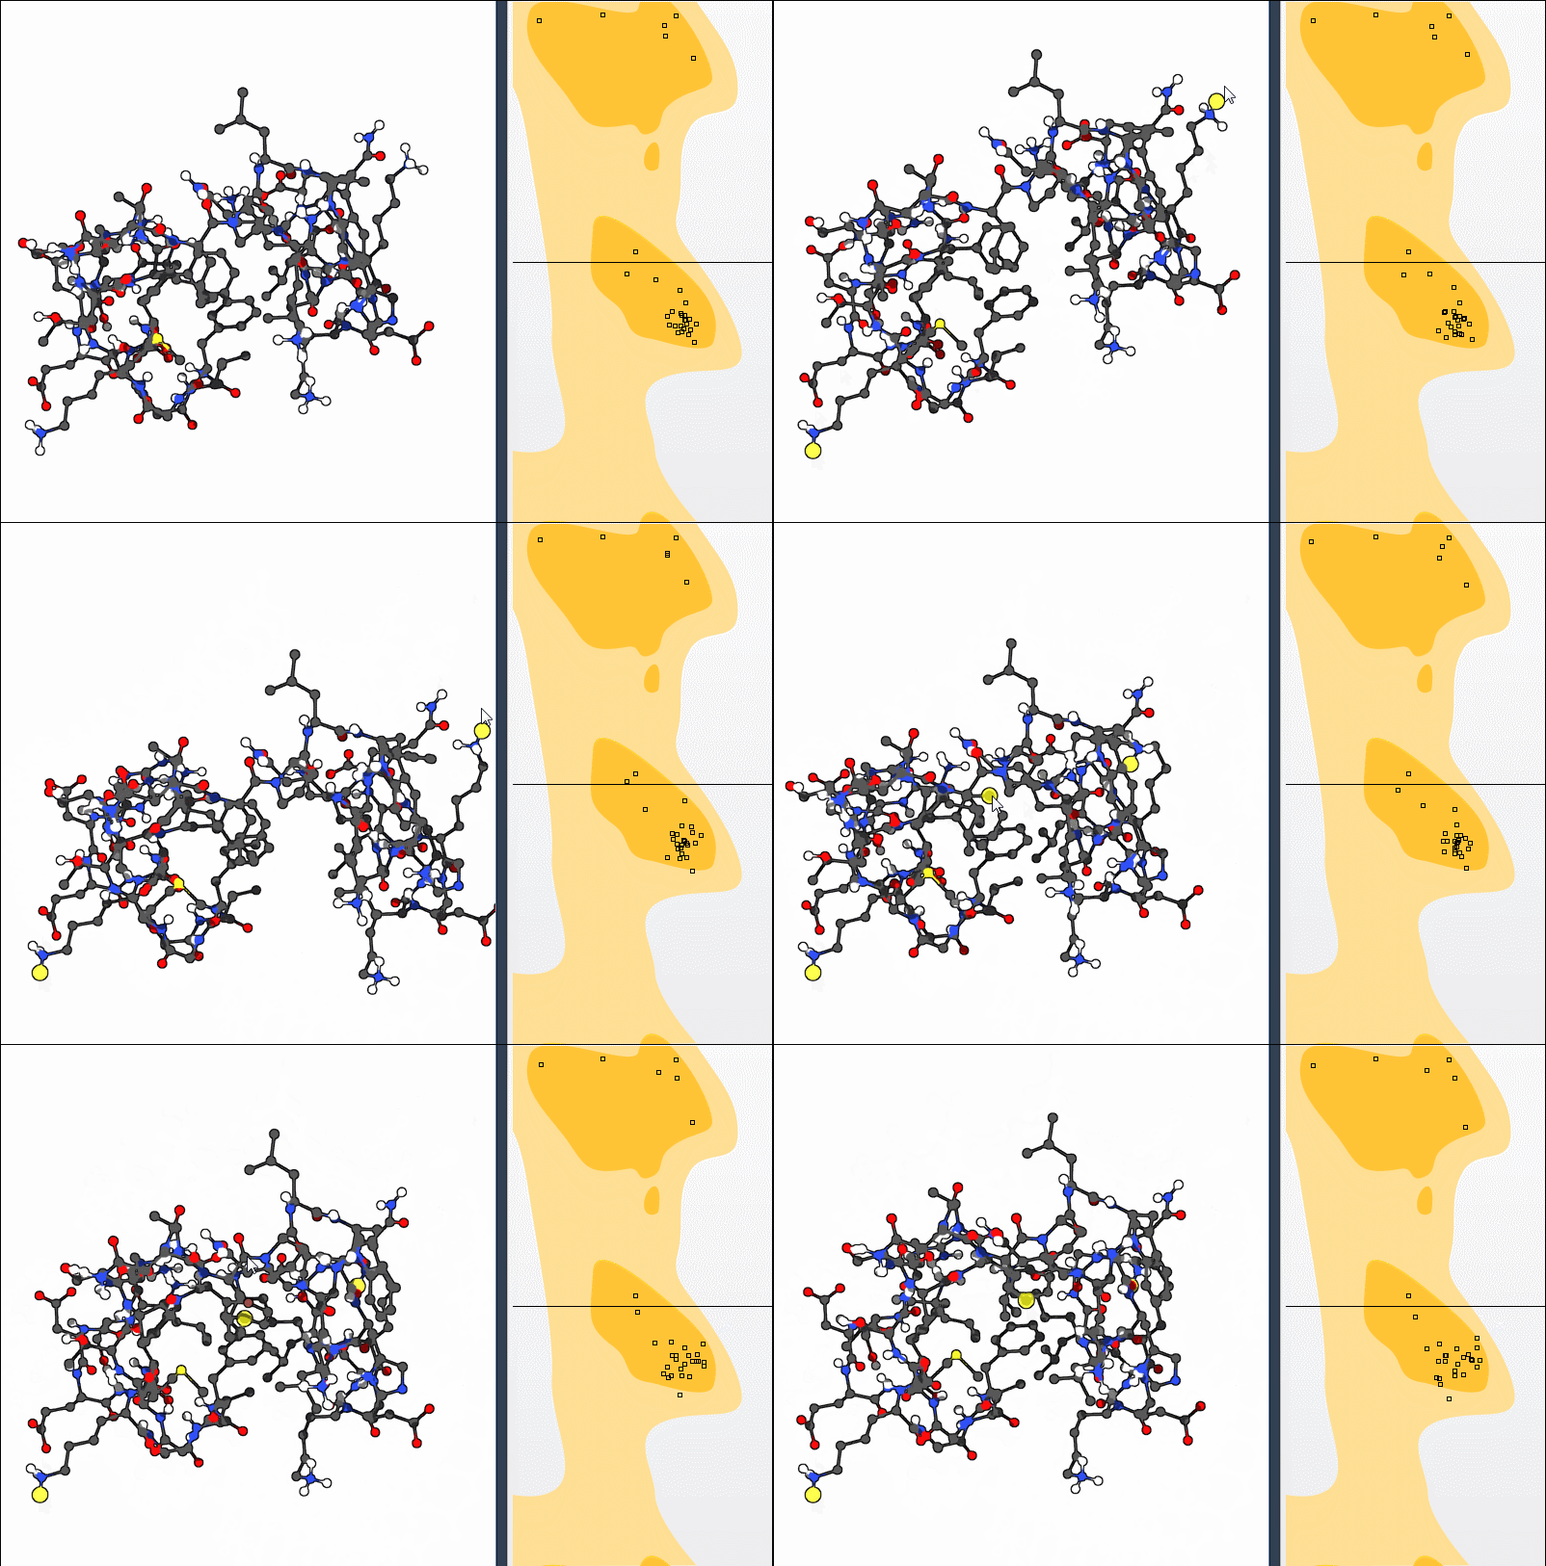
- Twist residues directly in the 3D structure, and watch the plot update live to verify adjustments.
Here’s a visual demonstration:
Applications in Molecular Design
The ability to interactively analyze and edit residues has practical implications for:
- Homology model refinement: Identify and fix outlier residues to strengthen structural models.
- Simulation preparation: Locate and adjust strained residues for smoother simulation workflows.
- Binding site studies: Understand backbone flexibility at key functional locations, enabling deeper insight into molecular mechanics.
Conclusion
With its real-time editing capabilities, intuitive visual cues, and seamless integration within the SAMSON platform, the Interactive Ramachandran Plot provides molecular modelers with an efficient way to validate and improve their protein structures. Whether you’re refining a homology model or preparing a structure for simulation, this tool is a valuable addition to your workflow. Learn more in the full tutorial.
SAMSON and all SAMSON Extensions are free for non-commercial use. Get started by downloading SAMSON at https://www.samson-connect.net.